2. In Microsoft Excel, calculate the Payback Period, Internal Rate of Return (IRR), Net Present Value (NPV), and Profitability Index (PI) for each investment option (A, B and C).Investment A Initial Expenditure Year #1 Year #2 Year #3 Year #4 Year #5 Net Investment Cost ($700,000) Additional Revenue $100,000 = $200,000 $300,000 $450,000 $600,000 Additional Operating Expenses ($40,000) | ($40,000) = ($40,000) = ($40,000) ($40,000) Amortization ($42,424) | ($84,848) | ($127,273) ($190,909) ($254,545) Net Increase in Income ($700,000) $17,576 $75,152 $132,727 $219,091 = $305,455 Less: Tax @ 33% (65,800) | (524,800) = ($43,800) = ($72,300) ($100,800) Increase in Aftertax Income $11,776 $50,352 $88,927 $146,791 $204,655 Add back Amortization $42424 © $84,848 © $127,273 $190,909 = $254,545 Net Change in Cash Flow ($700,000) $54200 | $135200 $216,200 $337,700 $459,200 Discount Rate ? Investment B Initial Expenditure Year #1 Year #2 Year #3 Year #4 Year #5 Net Investment Cost ($540,000) Additional Revenue $382,500 | $325,125 $125,000 $100,000 $85,000 Additional Operating Expenses ($19,125) | ($19,125) = ($25,500) = ($31,875) = ($38,250) Amortization (6202,973) | ($172,527) ($66,331) ($53,065) = ($45,105) Net Increase in Income ($540,000) $160,402 $133473 $33,169 $15,060 $1,645 Less: Tax@ 33% ($52,933) | ($44,046) (510,946) ($4970) ($543) Increase in Aftertax Income $107,470 $89,427 $22,223 $10,090 $1,102 Add back Amortization $202,973 © $172527 = $66,331 $53,065 $45,105 Net Change in Cash Flow ($540,000) $310,442 $261,954 $88,554 $63,155 $46,207 Discount Rate ? Investment C Initial Expenditure Year #1 Year #2 Year #3 Year #4 Year #5 Net Investment Cost ($720,000) Additional Revenue $87,500 $175000 $262,250 $393,750 = $525,000 Additional Operating Expenses ($26,250) | ($26,250) = ($26,250) = ($26,250) = ($26,250) Amortization ($43,644) | ($87,288) | ($130,807) ($196,398) ($261,864) Net Increase in Income ($720,000) $17,606 $61,462 $105,193 $171,102 $236,886 Less: Tax @ 33% ($5,810) (520,283) ($34,714) ($56,464) = ($78,173) Increase in Aftertax Income $11,796 $41,180 $70,479 $114,639 $158,714 Add back Amortization $43644 | $87,288 $130,807 = $196,398 = $261,364 Net Change in Cash Flow ($720,000) $55,440 | $128467 $201,286 $311,036 $420,577 Discount Rate ?
Question:
2. In Microsoft Excel, calculate the Payback Period, Internal Rate of Return (IRR), Net Present Value (NPV), and Profitability Index (PI) for each investment option (A, B and C).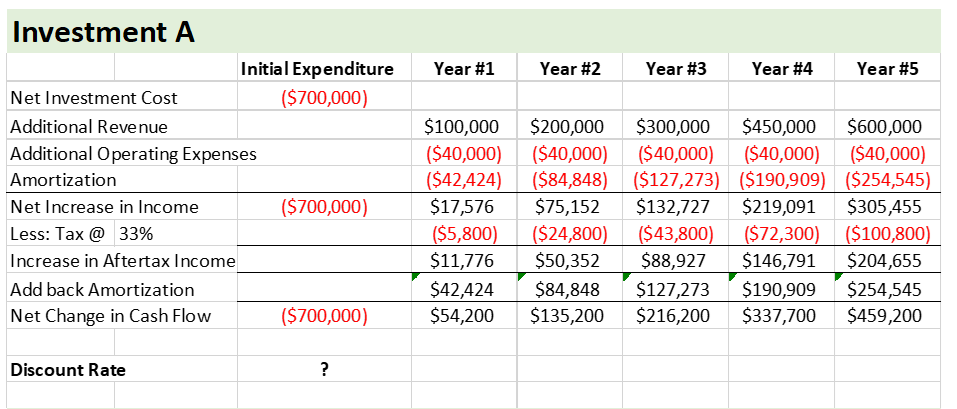
 Investment A
Initial Expenditure Year #1 Year #2 Year #3 Year #4 Year #5
Net Investment Cost ($700,000)
Additional Revenue $100,000 = $200,000 $300,000 $450,000 $600,000
Additional Operating Expenses ($40,000) | ($40,000) = ($40,000) = ($40,000) ($40,000)
Amortization ($42,424) | ($84,848) | ($127,273) ($190,909) ($254,545)
Net Increase in Income ($700,000) $17,576 $75,152 $132,727 $219,091 = $305,455
Less: Tax @ 33% (65,800) | (524,800) = ($43,800) = ($72,300) ($100,800)
Increase in Aftertax Income $11,776 $50,352 $88,927 $146,791 $204,655
Add back Amortization $42424 © $84,848 © $127,273 $190,909 = $254,545
Net Change in Cash Flow ($700,000) $54200 | $135200 $216,200 $337,700 $459,200
Discount Rate ?
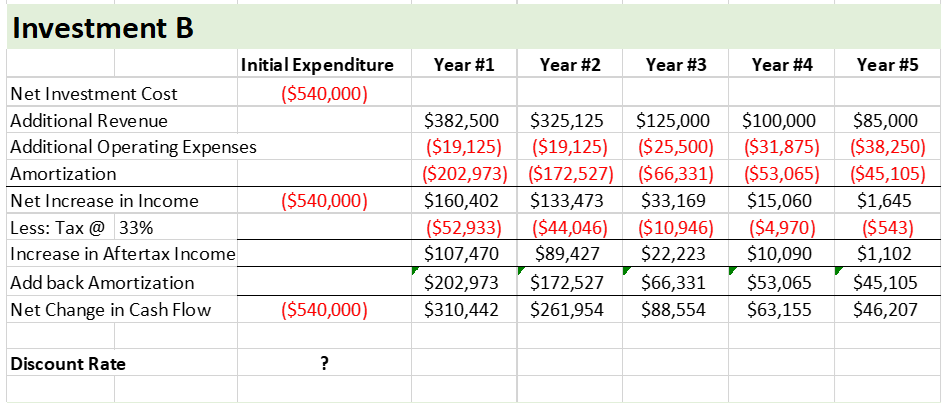
Investment B
Initial Expenditure Year #1 Year #2 Year #3 Year #4 Year #5
Net Investment Cost ($540,000)
Additional Revenue $382,500 | $325,125 $125,000 $100,000 $85,000
Additional Operating Expenses ($19,125) | ($19,125) = ($25,500) = ($31,875) = ($38,250)
Amortization (6202,973) | ($172,527) ($66,331) ($53,065) = ($45,105)
Net Increase in Income ($540,000) $160,402 $133473 $33,169 $15,060 $1,645
Less: Tax@ 33% ($52,933) | ($44,046) (510,946) ($4970) ($543)
Increase in Aftertax Income $107,470 $89,427 $22,223 $10,090 $1,102
Add back Amortization $202,973 © $172527 = $66,331 $53,065 $45,105
Net Change in Cash Flow ($540,000) $310,442 $261,954 $88,554 $63,155 $46,207
Discount Rate ?
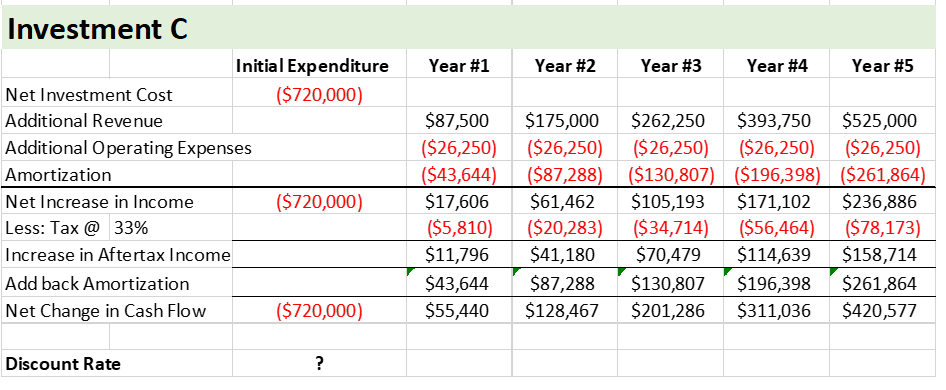
Investment C
Initial Expenditure Year #1 Year #2 Year #3 Year #4 Year #5
Net Investment Cost ($720,000)
Additional Revenue $87,500 $175000 $262,250 $393,750 = $525,000
Additional Operating Expenses ($26,250) | ($26,250) = ($26,250) = ($26,250) = ($26,250)
Amortization ($43,644) | ($87,288) | ($130,807) ($196,398) ($261,864)
Net Increase in Income ($720,000) $17,606 $61,462 $105,193 $171,102 $236,886
Less: Tax @ 33% ($5,810) (520,283) ($34,714) ($56,464) = ($78,173)
Increase in Aftertax Income $11,796 $41,180 $70,479 $114,639 $158,714
Add back Amortization $43644 | $87,288 $130,807 = $196,398 = $261,364
Net Change in Cash Flow ($720,000) $55,440 | $128467 $201,286 $311,036 $420,577
Discount Rate ?
Investment A
Initial Expenditure Year #1 Year #2 Year #3 Year #4 Year #5
Net Investment Cost ($700,000)
Additional Revenue $100,000 = $200,000 $300,000 $450,000 $600,000
Additional Operating Expenses ($40,000) | ($40,000) = ($40,000) = ($40,000) ($40,000)
Amortization ($42,424) | ($84,848) | ($127,273) ($190,909) ($254,545)
Net Increase in Income ($700,000) $17,576 $75,152 $132,727 $219,091 = $305,455
Less: Tax @ 33% (65,800) | (524,800) = ($43,800) = ($72,300) ($100,800)
Increase in Aftertax Income $11,776 $50,352 $88,927 $146,791 $204,655
Add back Amortization $42424 © $84,848 © $127,273 $190,909 = $254,545
Net Change in Cash Flow ($700,000) $54200 | $135200 $216,200 $337,700 $459,200
Discount Rate ?
Investment B
Initial Expenditure Year #1 Year #2 Year #3 Year #4 Year #5
Net Investment Cost ($540,000)
Additional Revenue $382,500 | $325,125 $125,000 $100,000 $85,000
Additional Operating Expenses ($19,125) | ($19,125) = ($25,500) = ($31,875) = ($38,250)
Amortization (6202,973) | ($172,527) ($66,331) ($53,065) = ($45,105)
Net Increase in Income ($540,000) $160,402 $133473 $33,169 $15,060 $1,645
Less: Tax@ 33% ($52,933) | ($44,046) (510,946) ($4970) ($543)
Increase in Aftertax Income $107,470 $89,427 $22,223 $10,090 $1,102
Add back Amortization $202,973 © $172527 = $66,331 $53,065 $45,105
Net Change in Cash Flow ($540,000) $310,442 $261,954 $88,554 $63,155 $46,207
Discount Rate ?
Investment C
Initial Expenditure Year #1 Year #2 Year #3 Year #4 Year #5
Net Investment Cost ($720,000)
Additional Revenue $87,500 $175000 $262,250 $393,750 = $525,000
Additional Operating Expenses ($26,250) | ($26,250) = ($26,250) = ($26,250) = ($26,250)
Amortization ($43,644) | ($87,288) | ($130,807) ($196,398) ($261,864)
Net Increase in Income ($720,000) $17,606 $61,462 $105,193 $171,102 $236,886
Less: Tax @ 33% ($5,810) (520,283) ($34,714) ($56,464) = ($78,173)
Increase in Aftertax Income $11,796 $41,180 $70,479 $114,639 $158,714
Add back Amortization $43644 | $87,288 $130,807 = $196,398 = $261,364
Net Change in Cash Flow ($720,000) $55,440 | $128467 $201,286 $311,036 $420,577
Discount Rate ?
Asked by: Ubaid
Created at: 2025-07-24 14:49:12
Final Answer:
📢 Instructions:
- Ask anything relatd to above question only.
- For new Question goto :