 VIPSolutions
Act like a helpful tutor and exlain me :LG Bat HEE ggg’ EEF 3 7588 | EEE iges | £872 Eglo LEE | EEE REE | g§5E ) §sg 2 2% ) » 25 sii £38 3 c= Big SEE £2s seg | g EE £38 dos
Question:
Act like a helpful tutor and exlain me :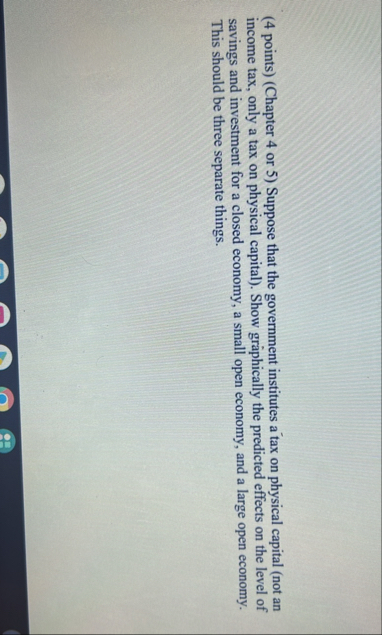 LG
Bat
HEE
ggg’
EEF 3
7588 |
EEE
iges |
£872
Eglo
LEE |
EEE
REE |
g§5E
) §sg
2 2%
) » 25
sii
£38
3 c=
Big
SEE
£2s
seg |
g EE
£38
dos
LG
Bat
HEE
ggg’
EEF 3
7588 |
EEE
iges |
£872
Eglo
LEE |
EEE
REE |
g§5E
) §sg
2 2%
) » 25
sii
£38
3 c=
Big
SEE
£2s
seg |
g EE
£38
dos
This is AI generated Response.
Asked by: Alok Kumar
Created at: 2026-02-02 10:51:22
Asked by: Alok Kumar
Created at: 2026-02-02 10:51:22
Final Answer:
Rendered
Raw Text
Did you like this answer?
# Explaining Effects of a Tax on Physical Capital
Let's break down your question step by step!
---
## **Question Restatement**
**Suppose the government institutes a tax on physical capital (not an income tax, only a tax on physical capital). Show graphically the predicted effects on the level of savings and investment for:**
1. **A closed economy**
2. **A small open economy**
3. **A large open economy**
---
## **Key Concepts**
- **Physical capital**: Machines, buildings, equipment used in production.
- **Tax on physical capital**: Increases the cost of using/owning capital.
- **Savings (S)**: Income not consumed.
- **Investment (I)**: Spending on new physical capital.
- **Closed economy**: No international trade or capital flows.
- **Small open economy**: Can borrow/lend freely at world interest rate.
- **Large open economy**: Can influence the world interest rate but still trades/invests internationally.
---
## 1. **Closed Economy**
### **Explanation**
- The tax increases the cost of capital, so firms invest less.
- **Investment demand** curve shifts **left** (down).
- **Savings** depends on interest rate; with less investment, equilibrium interest rate falls, and so does investment.
### **Graph**
- **X-axis:** Quantity of loanable funds (Savings/Investment)
- **Y-axis:** Interest rate (r)
- **S** = Savings curve (upward sloping or vertical)
- **I** = Investment curve (downward sloping)
- Tax shifts **I** to the left: New intersection has **lower r** and **lower I (= S)**.
---
## 2. **Small Open Economy**
### **Explanation**
- Interest rate is set by the world market (**r = r\_world**).
- Domestic investment falls due to the tax.
- At the same r\_world, **savings is unchanged**, but **investment falls**.
- The gap between S and I is made up by changes in **net capital outflow** (or net exports).
### **Graph**
- **X-axis:** Quantity of funds
- **Y-axis:** Interest rate (r)
- **Horizontal line** at **r = r\_world**.
- **S** and **I** curves as before.
- **I** shifts left: At r\_world, **savings stays the same**, **investment falls**, so **net capital outflow increases** (country sends more capital abroad).
---
## 3. **Large Open Economy**
### **Explanation**
- Large enough to affect the world interest rate.
- Tax reduces investment demand in that country and thus **reduces global demand for funds**.
- This **lowers the world interest rate** slightly.
- **Savings in that country** may also adjust (slightly higher due to lower world rate).
- **Investment falls**, but world capital markets partially absorb the change.
### **Graph**
- Similar to above, but now the **equilibrium world interest rate falls** a bit.
- **S** and **I** curves for the large economy, with **I** shifting left.
- Intersection moves to a lower interest rate and lower investment.
---
## **Summary Table**
| Economy Type | Effect on Savings | Effect on Investment | Effect on Interest Rate |
|---------------------|------------------|---------------------|---------------------------|
| Closed Economy | Down | Down | Down |
| Small Open Economy | Same | Down | Same (world rate) |
| Large Open Economy | Up (slightly) | Down | Down (world rate drops) |
---
## **Visual Summary**
Here’s a simplified generic graph for each case:
### **Closed Economy**

*Investment curve shifts left; new lower equilibrium for r and I.*
### **Small Open Economy**

*World interest rate unchanged; investment falls, savings unchanged, net capital outflow rises.*
### **Large Open Economy**

*Investment curve shifts left; world interest rate drops a bit, investment falls, savings rises a bit.*
---
If you'd like, I can draw these graphs with labels—just ask!
📢 Instructions:
- Ask anything relatd to above question only.
- For new Question goto :