give answer question wise and give final summaryesisors for electronic circuits are manufactured on a high-speed automated machine. The machine i set up to produce a large run of esistors of 1000 ohms each. Use Exbit 137, To set up the machine and to create a control chart to be used throughout the un, 15 samples were taken with four resistors in each mpl. The complete ist of amples and their measured values are 5 follows: Use three-sigma control mis a3 in EXNIoR 137. Supe NUMBER READINGS (IN os) TT amd aes sre ae 3 los ame ses a 5 ame am wn am iE aa am ae ┬ú0 de ma sw le ┬ž am am oe 1am $l a ses aw Ean an mea 5 Tan ano lew Bo os owe des dew Ho we de 9a em no ami me an ew Bo ms ose on wm 1 we we on se FR Calculate the mean and range for the above samples. Note: Round "Mean o 2 decimal places and "Range" t the nearest whole number. pb rr 1 | EX A ÔÇö ON A ÔÇö | EX A ÔÇö rT 1 | CON AS ÔÇö ECHR A A EH AS A EEK AS A pT 1 Determine Xand R. Note: Round your answers to 3 decimal places. . Determine the UCL and LCL for an X chart Note: Round your answers to 3 decimal places. Determine the UCL and LCL for an Rchart Notes Leave no cols lank - be certain to enter "0" wherever required. Round your answers to 3 decimal places. . What comments can you make about the process? ┬ę The process sin statistcal control. ┬ę The process is out of statistical control.
Question:
give answer question wise and give final summary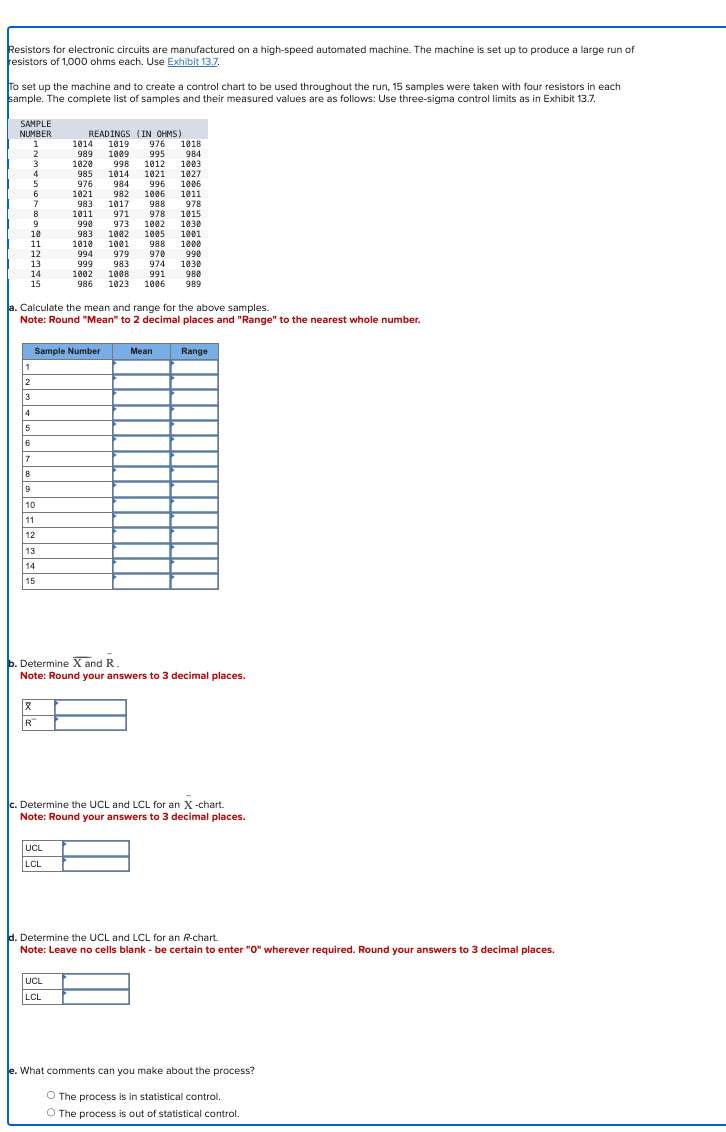 esisors for electronic circuits are manufactured on a high-speed automated machine. The machine i set up to produce a large run of
esistors of 1000 ohms each. Use Exbit 137,
To set up the machine and to create a control chart to be used throughout the un, 15 samples were taken with four resistors in each
mpl. The complete ist of amples and their measured values are 5 follows: Use three-sigma control mis a3 in EXNIoR 137.
Supe
NUMBER READINGS (IN os)
TT amd aes sre ae
3 los ame ses a
5 ame am wn am
iE aa am ae
£0 de ma sw le
┬ž am am oe 1am
$l a ses aw
Ean an mea
5 Tan ano lew
Bo os owe des dew
Ho we de 9a em
no ami me an ew
Bo ms ose on wm
1 we we on se
FR
Calculate the mean and range for the above samples.
Note: Round "Mean o 2 decimal places and "Range" t the nearest whole number.
pb rr 1
| EX A ÔÇö
ON A ÔÇö
| EX A ÔÇö
rT 1
| CON AS ÔÇö
ECHR A A
EH AS A
EEK AS A
pT 1
Determine Xand R.
Note: Round your answers to 3 decimal places.
. Determine the UCL and LCL for an X chart
Note: Round your answers to 3 decimal places.
Determine the UCL and LCL for an Rchart
Notes Leave no cols lank - be certain to enter "0" wherever required. Round your answers to 3 decimal places.
. What comments can you make about the process?
┬ę The process sin statistcal control.
┬ę The process is out of statistical control.
esisors for electronic circuits are manufactured on a high-speed automated machine. The machine i set up to produce a large run of
esistors of 1000 ohms each. Use Exbit 137,
To set up the machine and to create a control chart to be used throughout the un, 15 samples were taken with four resistors in each
mpl. The complete ist of amples and their measured values are 5 follows: Use three-sigma control mis a3 in EXNIoR 137.
Supe
NUMBER READINGS (IN os)
TT amd aes sre ae
3 los ame ses a
5 ame am wn am
iE aa am ae
£0 de ma sw le
┬ž am am oe 1am
$l a ses aw
Ean an mea
5 Tan ano lew
Bo os owe des dew
Ho we de 9a em
no ami me an ew
Bo ms ose on wm
1 we we on se
FR
Calculate the mean and range for the above samples.
Note: Round "Mean o 2 decimal places and "Range" t the nearest whole number.
pb rr 1
| EX A ÔÇö
ON A ÔÇö
| EX A ÔÇö
rT 1
| CON AS ÔÇö
ECHR A A
EH AS A
EEK AS A
pT 1
Determine Xand R.
Note: Round your answers to 3 decimal places.
. Determine the UCL and LCL for an X chart
Note: Round your answers to 3 decimal places.
Determine the UCL and LCL for an Rchart
Notes Leave no cols lank - be certain to enter "0" wherever required. Round your answers to 3 decimal places.
. What comments can you make about the process?
┬ę The process sin statistcal control.
┬ę The process is out of statistical control.
Asked by: lincy
Created at: 2025-10-27 10:33:24
Final Answer:
čôó Instructions:
- Ask anything relatd to above question only.
- For new Question goto :