give full answer with step by step answer and give final summmary| Homework 6 - Question 3 - Build Plants - Transportation Model Objective: . Net Cost Per Unit Construction To Supply Customer Plant Production Capacif Cost X Y 4 1 40000 $1,325,000 $35 $30 $45 2 30000 $1,100,000 $45 $40 $50 3 50000 $1,500,000 $70 $65 $50 4 20000 $1,200,000 $20 $45 $25 5 40000 $1,400,000 $65 $45 $45 Suppose plants 1and 2 represent different building alternatives for the same site (that is, only one of these plants can be built). Similarly, suppose plants 4 and 5 represent different building alternatives for another site. The company wants to determine which plants to build in order to satisfy customer demand at minimum total cost. Total cost=$[_] A manufacturer is considering alternatives for building new plants in order to be located closer to three of its primary customers with whom it intends to develop long-term relationships. The net cost of manufacturing and transporting each unit of the product to its customers (X, Y, and Z) will vary depending on where the plant is built and the production capacity of the plant. These costs are ‘summarized in the following table: [Pam [x [ v _ | 7 1 [ss | wo | ss ES I~ S —— —— 5 [sno | ss | so [a [so | ss | ss 5 1 ses | ss | sas | The annual demand for products from customers X, Y, and Z is expected to be 41,000, 26,000, and 35,000 units, respectively. The annual production capacity and construction costs for each plant are given in the following table: [7 [ow | samo ES I SS I 1 — [3 [soo | sisoooo0 [a [soon | siaoo0 [5 [aon | sooo |
Question:
give full answer with step by step answer and give final summmary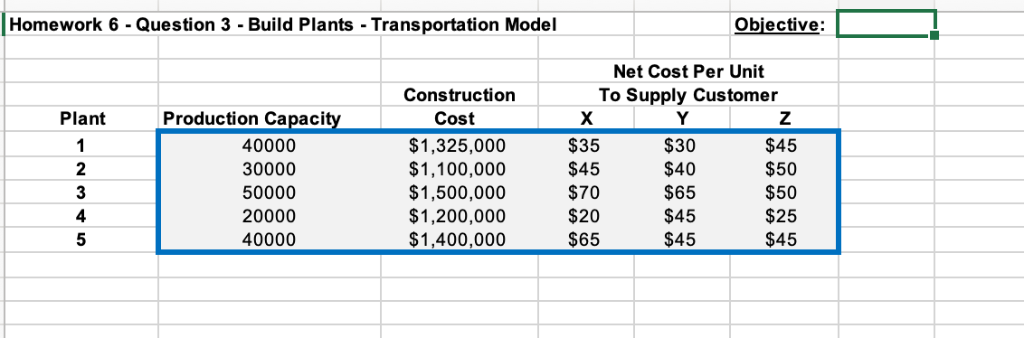
 | Homework 6 - Question 3 - Build Plants - Transportation Model Objective: .
Net Cost Per Unit
Construction To Supply Customer
Plant Production Capacif Cost X Y 4
1 40000 $1,325,000 $35 $30 $45
2 30000 $1,100,000 $45 $40 $50
3 50000 $1,500,000 $70 $65 $50
4 20000 $1,200,000 $20 $45 $25
5 40000 $1,400,000 $65 $45 $45
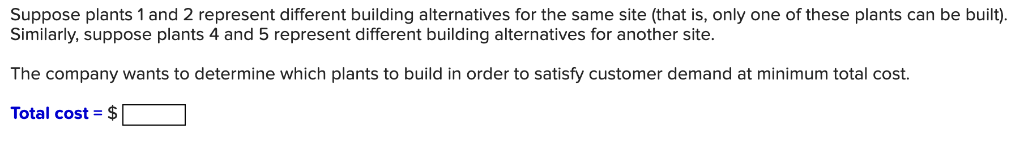
Suppose plants 1and 2 represent different building alternatives for the same site (that is, only one of these plants can be built).
Similarly, suppose plants 4 and 5 represent different building alternatives for another site.
The company wants to determine which plants to build in order to satisfy customer demand at minimum total cost.
Total cost=$[_]
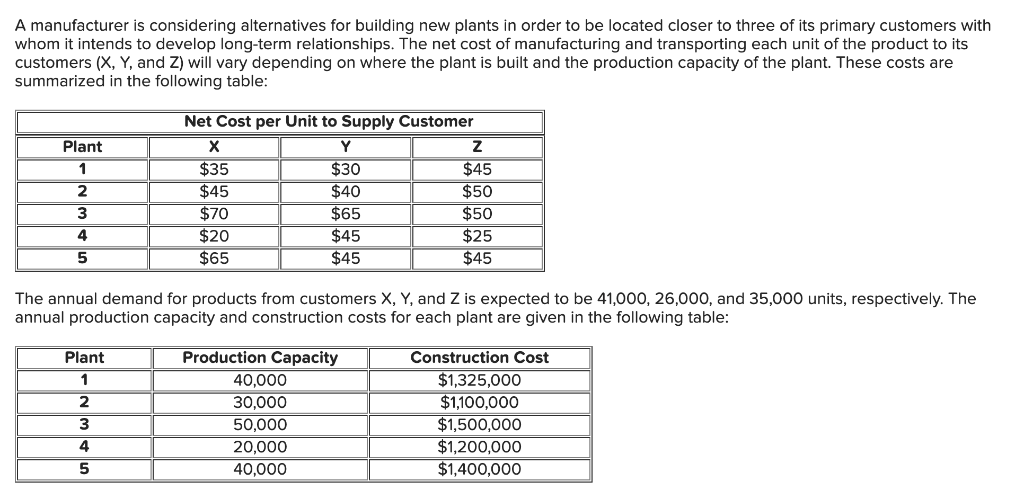
A manufacturer is considering alternatives for building new plants in order to be located closer to three of its primary customers with
whom it intends to develop long-term relationships. The net cost of manufacturing and transporting each unit of the product to its
customers (X, Y, and Z) will vary depending on where the plant is built and the production capacity of the plant. These costs are
‘summarized in the following table:
[Pam [x [ v _ | 7
1 [ss | wo | ss
ES I~ S —— ——
5 [sno | ss | so
[a [so | ss | ss
5 1 ses | ss | sas |
The annual demand for products from customers X, Y, and Z is expected to be 41,000, 26,000, and 35,000 units, respectively. The
annual production capacity and construction costs for each plant are given in the following table:
[7 [ow | samo
ES I SS I 1 —
[3 [soo | sisoooo0
[a [soon | siaoo0
[5 [aon | sooo |
| Homework 6 - Question 3 - Build Plants - Transportation Model Objective: .
Net Cost Per Unit
Construction To Supply Customer
Plant Production Capacif Cost X Y 4
1 40000 $1,325,000 $35 $30 $45
2 30000 $1,100,000 $45 $40 $50
3 50000 $1,500,000 $70 $65 $50
4 20000 $1,200,000 $20 $45 $25
5 40000 $1,400,000 $65 $45 $45
Suppose plants 1and 2 represent different building alternatives for the same site (that is, only one of these plants can be built).
Similarly, suppose plants 4 and 5 represent different building alternatives for another site.
The company wants to determine which plants to build in order to satisfy customer demand at minimum total cost.
Total cost=$[_]
A manufacturer is considering alternatives for building new plants in order to be located closer to three of its primary customers with
whom it intends to develop long-term relationships. The net cost of manufacturing and transporting each unit of the product to its
customers (X, Y, and Z) will vary depending on where the plant is built and the production capacity of the plant. These costs are
‘summarized in the following table:
[Pam [x [ v _ | 7
1 [ss | wo | ss
ES I~ S —— ——
5 [sno | ss | so
[a [so | ss | ss
5 1 ses | ss | sas |
The annual demand for products from customers X, Y, and Z is expected to be 41,000, 26,000, and 35,000 units, respectively. The
annual production capacity and construction costs for each plant are given in the following table:
[7 [ow | samo
ES I SS I 1 —
[3 [soo | sisoooo0
[a [soon | siaoo0
[5 [aon | sooo |
Asked by: lincy
Created at: 2025-10-26 22:55:16
Final Answer:
📢 Instructions:
- Ask anything relatd to above question only.
- For new Question goto :