Give step-by-step solution with explanation and final answer:Problem 1: The chart below shows the number of ice cream cones sold at Buddy's Ice Cream Parlor £rom Monday through Friday: [ [wonday [Tuesday [Wednesday [Thursday [Friday | Fri fee Lis De Le fw fo | A computer commiting firm presently bas bids out sm three projects. Lat A= [Oosstas Juz Jor fot Iw Jo | (awarded project 0), for 1 = 13,3. Swpese that: P(A) = 0.22, PU = 0.25, (EE EEN ECT ER ETN EC PAD=028 . PANAD=011 . PUAAD=005 . PUA) =0.07, PUAL(143 142) = 0.01. Express in words each of the following events, and compute a Wat vas the mess sale for vanilla? To hair of aN ses 5. That vas the mean sale for all flavors on Nonday? ©. Find the nedian datly sales for chocolate. . aUA 4 Construct histogram for strasberry ice cream cones sold. wana © AUA UA Problen 2: 4 Anna Blood pressure values are often reported to the nearest 5 malig (100, 105, 110, ete.), ANAM, suppose the actual blood pressure values for nine randomly selected individuals are: 1 (ANADUA, LBS 124 134 10.0 LNT 120 1083 135 188.2 Problem 6: oho main oi reparti Bisod sass; viiieid Prove the proposition of span: PAU BLIC) fn page 63 of the textbook. b. That 1s the mean of the reported blood pressure values? What fs the 108 trimmed sean? ©. Suppose the blood pressure of the second individual is 127.6 rather than 127.4, How does this affect the median, mean, and 10% trimmed mean of the reported PROPOSITION | For any three events A. B, andl C. values? That docs this say about the sensitivity of these data? PAUBUO = PA) + AB) + RO) ~ PAB) ~ PA NC) “PEOC+ AANENG Probes 3: Use Venn diagrams to verify the De Morgan’ 3 law: “This can be verified by examining the Venn diagram of A U # UC. shown in Figure . UUW ane 26 When PU), AB), snd LC) ar add. the ection ecb PUA 1). A 0 C.and AUR 11 ell coun twice. Ech one at thereon be sbencied. bans =aus But hen UA (110) hs bo aod in the ie ed sured ot de dims, 201t must be addd bck. In gener, the probability of + union of £ vos i bind Problem 4: ‘by summing individual event probabilities. subtracting double intersection probabilities. A family constating of three persons, A B, and C, goes to a medical clinic that oro se sl always Bas a doctor at each of stations 1,2, aad 3. During a certain week, each ES mesber of the family visits the clinic once and is assigned at random to a station. r \¥ The copertant conto of recat the tation mabe fo cach member On otc iid 15 (1,2,1) for A to station 1, B to station 2, C to station L. [rp a List the 27 outcomes fn the sample space. b. List all cutcoses in the event that all three mesbers go to the same station. ©. List all outcomes in the event that all mesbers o to different station. & List all cutcones n the event that 50 one goes to station 2.
Question:
Give step-by-step solution with explanation and final answer: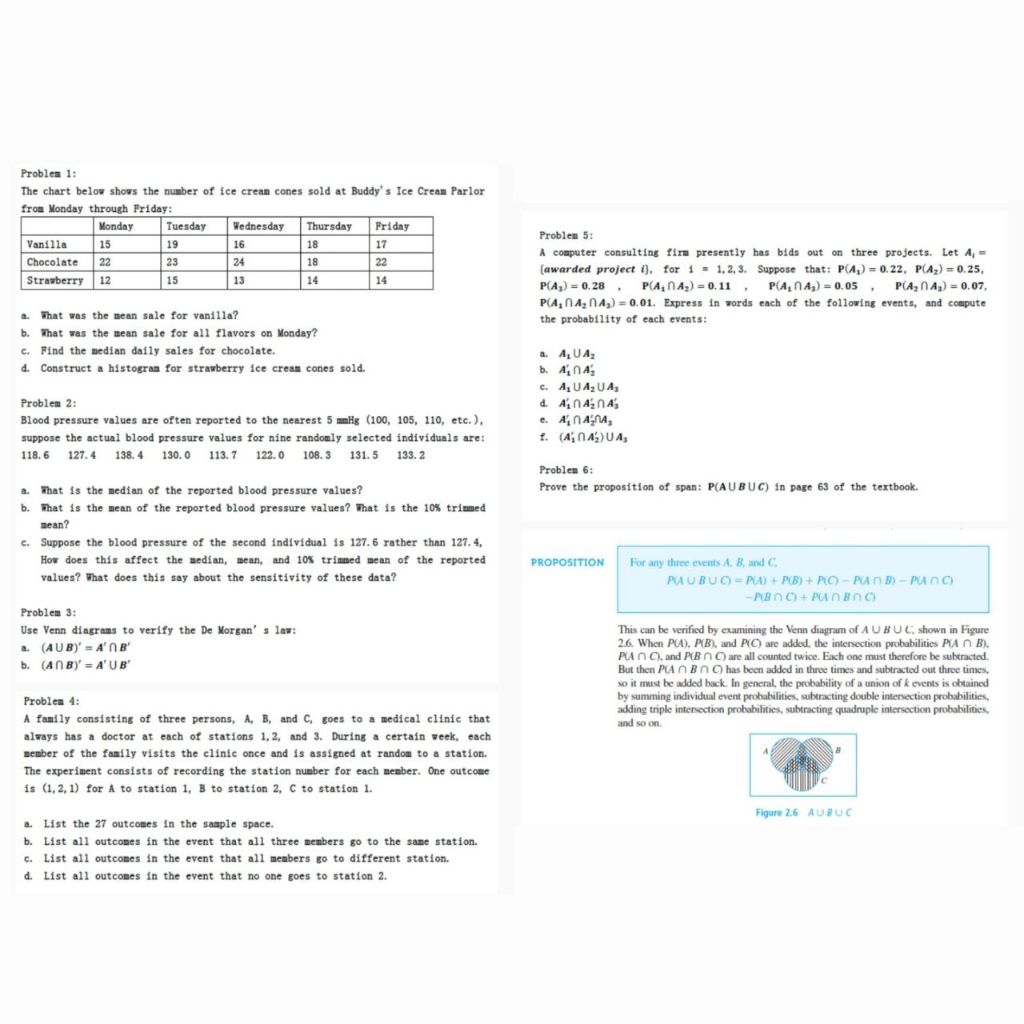 Problem 1:
The chart below shows the number of ice cream cones sold at Buddy's Ice Cream Parlor
£rom Monday through Friday:
[ [wonday [Tuesday [Wednesday [Thursday [Friday | Fri
fee Lis De Le fw fo | A computer commiting firm presently bas bids out sm three projects. Lat A=
[Oosstas Juz Jor fot Iw Jo | (awarded project 0), for 1 = 13,3. Swpese that: P(A) = 0.22, PU = 0.25,
(EE EEN ECT ER ETN EC PAD=028 . PANAD=011 . PUAAD=005 . PUA) =0.07,
PUAL(143 142) = 0.01. Express in words each of the following events, and compute
a Wat vas the mess sale for vanilla? To hair of aN ses
5. That vas the mean sale for all flavors on Nonday?
©. Find the nedian datly sales for chocolate. . aUA
4 Construct histogram for strasberry ice cream cones sold. wana
© AUA UA
Problen 2: 4 Anna
Blood pressure values are often reported to the nearest 5 malig (100, 105, 110, ete.), ANAM,
suppose the actual blood pressure values for nine randomly selected individuals are: 1 (ANADUA,
LBS 124 134 10.0 LNT 120 1083 135 188.2
Problem 6:
oho main oi reparti Bisod sass; viiieid Prove the proposition of span: PAU BLIC) fn page 63 of the textbook.
b. That 1s the mean of the reported blood pressure values? What fs the 108 trimmed
sean?
©. Suppose the blood pressure of the second individual is 127.6 rather than 127.4,
How does this affect the median, mean, and 10% trimmed mean of the reported PROPOSITION | For any three events A. B, andl C.
values? That docs this say about the sensitivity of these data? PAUBUO = PA) + AB) + RO) ~ PAB) ~ PA NC)
“PEOC+ AANENG
Probes 3:
Use Venn diagrams to verify the De Morgan’ 3 law: “This can be verified by examining the Venn diagram of A U # UC. shown in Figure
. UUW ane 26 When PU), AB), snd LC) ar add. the ection ecb PUA 1).
A 0 C.and AUR 11 ell coun twice. Ech one at thereon be sbencied.
bans =aus But hen UA (110) hs bo aod in the ie ed sured ot de dims,
201t must be addd bck. In gener, the probability of + union of £ vos i bind
Problem 4: ‘by summing individual event probabilities. subtracting double intersection probabilities.
A family constating of three persons, A B, and C, goes to a medical clinic that oro se sl
always Bas a doctor at each of stations 1,2, aad 3. During a certain week, each ES
mesber of the family visits the clinic once and is assigned at random to a station. r \¥
The copertant conto of recat the tation mabe fo cach member On otc iid
15 (1,2,1) for A to station 1, B to station 2, C to station L.
[rp
a List the 27 outcomes fn the sample space.
b. List all cutcoses in the event that all three mesbers go to the same station.
©. List all outcomes in the event that all mesbers o to different station.
& List all cutcones n the event that 50 one goes to station 2.
Problem 1:
The chart below shows the number of ice cream cones sold at Buddy's Ice Cream Parlor
£rom Monday through Friday:
[ [wonday [Tuesday [Wednesday [Thursday [Friday | Fri
fee Lis De Le fw fo | A computer commiting firm presently bas bids out sm three projects. Lat A=
[Oosstas Juz Jor fot Iw Jo | (awarded project 0), for 1 = 13,3. Swpese that: P(A) = 0.22, PU = 0.25,
(EE EEN ECT ER ETN EC PAD=028 . PANAD=011 . PUAAD=005 . PUA) =0.07,
PUAL(143 142) = 0.01. Express in words each of the following events, and compute
a Wat vas the mess sale for vanilla? To hair of aN ses
5. That vas the mean sale for all flavors on Nonday?
©. Find the nedian datly sales for chocolate. . aUA
4 Construct histogram for strasberry ice cream cones sold. wana
© AUA UA
Problen 2: 4 Anna
Blood pressure values are often reported to the nearest 5 malig (100, 105, 110, ete.), ANAM,
suppose the actual blood pressure values for nine randomly selected individuals are: 1 (ANADUA,
LBS 124 134 10.0 LNT 120 1083 135 188.2
Problem 6:
oho main oi reparti Bisod sass; viiieid Prove the proposition of span: PAU BLIC) fn page 63 of the textbook.
b. That 1s the mean of the reported blood pressure values? What fs the 108 trimmed
sean?
©. Suppose the blood pressure of the second individual is 127.6 rather than 127.4,
How does this affect the median, mean, and 10% trimmed mean of the reported PROPOSITION | For any three events A. B, andl C.
values? That docs this say about the sensitivity of these data? PAUBUO = PA) + AB) + RO) ~ PAB) ~ PA NC)
“PEOC+ AANENG
Probes 3:
Use Venn diagrams to verify the De Morgan’ 3 law: “This can be verified by examining the Venn diagram of A U # UC. shown in Figure
. UUW ane 26 When PU), AB), snd LC) ar add. the ection ecb PUA 1).
A 0 C.and AUR 11 ell coun twice. Ech one at thereon be sbencied.
bans =aus But hen UA (110) hs bo aod in the ie ed sured ot de dims,
201t must be addd bck. In gener, the probability of + union of £ vos i bind
Problem 4: ‘by summing individual event probabilities. subtracting double intersection probabilities.
A family constating of three persons, A B, and C, goes to a medical clinic that oro se sl
always Bas a doctor at each of stations 1,2, aad 3. During a certain week, each ES
mesber of the family visits the clinic once and is assigned at random to a station. r \¥
The copertant conto of recat the tation mabe fo cach member On otc iid
15 (1,2,1) for A to station 1, B to station 2, C to station L.
[rp
a List the 27 outcomes fn the sample space.
b. List all cutcoses in the event that all three mesbers go to the same station.
©. List all outcomes in the event that all mesbers o to different station.
& List all cutcones n the event that 50 one goes to station 2.
Asked by: Sahzadi
Created at: 2026-03-07 21:14:44
Final Answer:
📢 Instructions:
- Ask anything relatd to above question only.
- For new Question goto :