Give step-by-step solution with explanation and final answer:[Jee EL
€ 5 C= expertchegg.com/qna/authoring/ansier ax @ i
Chegg ewerosa Mysolutions Gude) Notifications ©
Student question © Time Left: 01:55:37 Tagthe question Step by-step Final solution
Subject [+
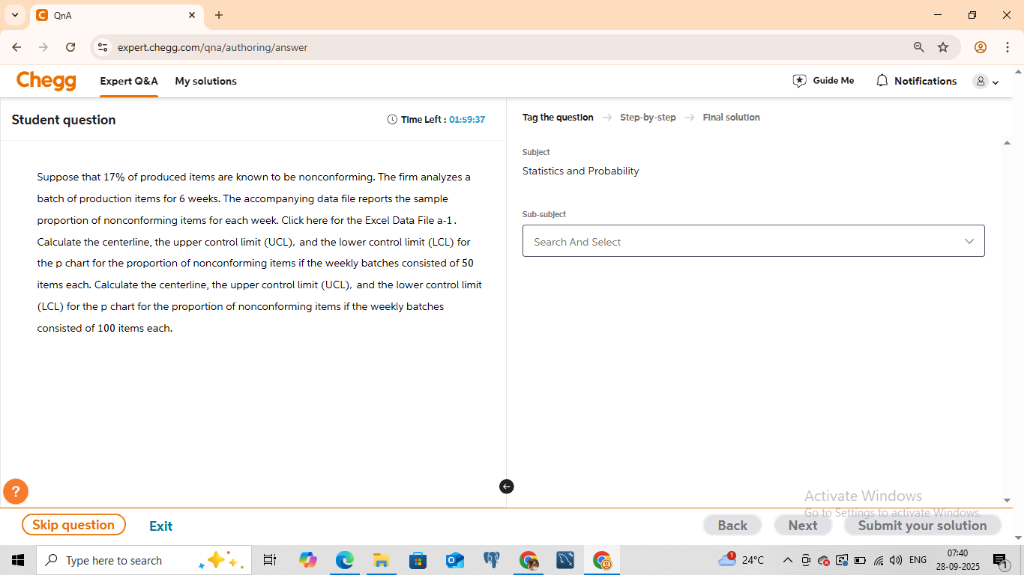
‘Suppose that 17% of produced items are known to be nonconforming. The firm analyzes a Statistics and Probability
ech of precio fn for 6 weet. The accompanying doa fe repors he sale
‘proportion of nenconforming items for each week. Click here for the Excel Data File a-1. P—
Cake th cererine, the upper conrl i (UCL. and th ower convo (LC) for Search nd Sect .
the chro the oporionof nonconforming ems fhe weekly batches consisted f SO
ems each. Clute he cererin, he upper antl (UCL), and he ower onl
(LCL) for the p chart for the proportion of nonconforming items if the weekly batches
consid of 100 ems each.
o ° J
Skip question ) Exit Back Next Submit your solution
. = En
EB Summers 4h. BH DE REBATE GE Mac rsaED a0 00
Question:
Give step-by-step solution with explanation and final answer:
This is AI generated Response. Asked by: anil Created at: 2025-09-28 07:41:05
Did you like this answer?
👍 0
👎 0
## Step-by-Step Solution
Let's solve the problem step by step.
### **Given Data**
- Proportion of nonconforming items (\( \overline{p} \)) = 17% = **.17**
- Two cases:
1. **Batch size (\( n \)) = 50**
2. **Batch size (\( n \)) = 100**
For a **p-chart**, we use the following formulas:
- **Centerline (CL):**
\[
CL = \overline{p}
\]
- **Standard deviation (\( \sigma_p \)):**
\[
\sigma_p = \sqrt{\frac{\overline{p}(1-\overline{p})}{n}}
\]
- **Upper Control Limit (UCL):**
\[
UCL = \overline{p} + 3\sigma_p
\]
- **Lower Control Limit (LCL):**
\[
LCL = \overline{p} - 3\sigma_p
\]
If LCL is negative, set it to .
---
## **Case 1: Batch Size \( n = 50 \)**
### 1. **Calculate the Centerline**
\[
CL = .17
\]
### 2. **Calculate the Standard Deviation**
\[
\sigma_p = \sqrt{\frac{.17 \times (1 - .17)}{50}} = \sqrt{\frac{.17 \times .83}{50}}
\]
\[
= \sqrt{\frac{.1411}{50}} = \sqrt{.002822} \approx .0532
\]
### 3. **Calculate UCL and LCL**
\[
UCL = .17 + 3 \times .0532 = .17 + .1596 = .3296
\]
\[
LCL = .17 - 3 \times .0532 = .17 - .1596 = .0104
\]
---
## **Case 2: Batch Size \( n = 100 \)**
### 1. **Calculate the Centerline**
\[
CL = .17
\]
### 2. **Calculate the Standard Deviation**
\[
\sigma_p = \sqrt{\frac{.17 \times (1 - .17)}{100}} = \sqrt{\frac{.1411}{100}} = \sqrt{.001411} \approx .0376
\]
### 3. **Calculate UCL and LCL**
\[
UCL = .17 + 3 \times .0376 = .17 + .1128 = .2828
\]
\[
LCL = .17 - 3 \times .0376 = .17 - .1128 = .0572
\]
---
## **Final Answers (Rounded to 4 decimal places):**
### **A. For batch size = 50:**
- **Centerline (CL):** .170
- **UCL:** .3296
- **LCL:** .0104
### **B. For batch size = 100:**
- **Centerline (CL):** .170
- **UCL:** .2828
- **LCL:** .0572
---
### **Summary Table**
| Batch Size | Centerline (CL) | UCL | LCL |
|------------|-----------------|--------|--------|
| 50 | .170 | .3296 | .0104 |
| 100 | .170 | .2828 | .0572 |
If you need further explanation, feel free to ask!
This is AI generated Response. Asked by: anil Created at: 2025-09-28 07:48:20
Did you like this answer?
👍 0
👎 0
# Step-by-Step Solution
Let's solve the problem step by step.
## Given Data
- **Proportion of nonconforming items (\( \overline{p} \))**: 17% or **0.17**
- **Batch sizes**:
1. \( n = 50 \)
2. \( n = 100 \)
## Formulas for p-chart
- **Centerline (CL)**:
\[
CL = \overline{p}
\]
- **Standard deviation (\( \sigma_p \))**:
\[
\sigma_p = \sqrt{\frac{\overline{p}(1-\overline{p})}{n}}
\]
- **Upper Control Limit (UCL)**:
\[
UCL = \overline{p} + 3\sigma_p
\]
- **Lower Control Limit (LCL)**:
\[
LCL = \overline{p} - 3\sigma_p
\]
If \( LCL \) is negative, set it to 0.
---
## Case 1: Batch Size \( n = 50 \)
### 1. Calculate the Centerline
\[
CL = 0.17
\]
### 2. Calculate the Standard Deviation
\[
\sigma_p = \sqrt{\frac{0.17 \times (1 - 0.17)}{50}} = \sqrt{\frac{0.17 \times 0.83}{50}} = \sqrt{\frac{0.1411}{50}} \approx 0.0532
\]
### 3. Calculate UCL and LCL
\[
UCL = 0.17 + 3 \times 0.0532 = 0.17 + 0.1596 = 0.3296
\]
\[
LCL = 0.17 - 3 \times 0.0532 = 0.17 - 0.1596 = 0.0104
\]
---
## Case 2: Batch Size \( n = 100 \)
### 1. Calculate the Centerline
\[
CL = 0.17
\]
### 2. Calculate the Standard Deviation
\[
\sigma_p = \sqrt{\frac{0.17 \times (1 - 0.17)}{100}} = \sqrt{\frac{0.1411}{100}} \approx 0.0376
\]
### 3. Calculate UCL and LCL
\[
UCL = 0.17 + 3 \times 0.0376 = 0.17 + 0.1128 = 0.2828
\]
\[
LCL = 0.17 - 3 \times 0.0376 = 0.17 - 0.1128 = 0.0572
\]
---
## Final Answers (Rounded to 4 decimal places)
### A. For Batch Size \( n = 50 \):
- **Centerline (CL)**: 0.1700
- **UCL**: 0.3296
- **LCL**: 0.0104
### B. For Batch Size \( n = 100 \):
- **Centerline (CL)**: 0.1700
- **UCL**: 0.2828
- **LCL**: 0.0572
---
## Summary Table
| Batch Size | Centerline (CL) | UCL | LCL |
|------------|-----------------|--------|--------|
| 50 | 0.1700 | 0.3296 | 0.0104 |
| 100 | 0.1700 | 0.2828 | 0.0572 |
If you have any further questions, feel free to ask!
📢 Instructions:
Ask anything relatd to above question only.
For new Question goto :
🚀 Submit (-0.25 Credits🪙)
Study Help, Fast Answers
VIPSolutions focuses on clear, step‑by‑step explanations so you can learn quickly. Whether you need an AI‑generated walkthrough or a short hint to get unstuck, each solution is organized for fast reading and easy review later.
Search similar questions, compare approaches, and bookmark the best answers for revision. Our goal is simple: quick, reliable study help that feels natural—not noisy.
 [Jee EL
€ 5 C= expertchegg.com/qna/authoring/ansier ax @ i
Chegg ewerosa Mysolutions Gude) Notifications ©
Student question © Time Left: 01:55:37 Tagthe question Step by-step Final solution
Subject [+
‘Suppose that 17% of produced items are known to be nonconforming. The firm analyzes a Statistics and Probability
ech of precio fn for 6 weet. The accompanying doa fe repors he sale
‘proportion of nenconforming items for each week. Click here for the Excel Data File a-1. P—
Cake th cererine, the upper conrl i (UCL. and th ower convo (LC) for Search nd Sect .
the chro the oporionof nonconforming ems fhe weekly batches consisted f SO
ems each. Clute he cererin, he upper antl (UCL), and he ower onl
(LCL) for the p chart for the proportion of nonconforming items if the weekly batches
consid of 100 ems each.
o ° J
Skip question ) Exit Back Next Submit your solution
. = En
EB Summers 4h. BH DE REBATE GE Mac rsaED a0 00
[Jee EL
€ 5 C= expertchegg.com/qna/authoring/ansier ax @ i
Chegg ewerosa Mysolutions Gude) Notifications ©
Student question © Time Left: 01:55:37 Tagthe question Step by-step Final solution
Subject [+
‘Suppose that 17% of produced items are known to be nonconforming. The firm analyzes a Statistics and Probability
ech of precio fn for 6 weet. The accompanying doa fe repors he sale
‘proportion of nenconforming items for each week. Click here for the Excel Data File a-1. P—
Cake th cererine, the upper conrl i (UCL. and th ower convo (LC) for Search nd Sect .
the chro the oporionof nonconforming ems fhe weekly batches consisted f SO
ems each. Clute he cererin, he upper antl (UCL), and he ower onl
(LCL) for the p chart for the proportion of nonconforming items if the weekly batches
consid of 100 ems each.
o ° J
Skip question ) Exit Back Next Submit your solution
. = En
EB Summers 4h. BH DE REBATE GE Mac rsaED a0 00