Give step-by-step solution with explanation and final answer: I urgently need an excel done for this following questions with the attached excel figures. The spreadsheet Return _ data.xlsx contains monthly returns ( total returns ) for the Fairfield Sentry fund and the S&P 1 0 0 index. The Fairfield Sentry fund is not randomly picked. I suggest that you get a sense of what happened to it before doing this assignment. For both return series, perform the following analysis. 1 . Create a table that provides estimates for their ( annualized ) means, variances, standard deviations, covariances and correlations. 2 . An autocorrelation is the correlation between a return and its previous return. Calculate the monthly autocorrelation for the Fairfield Sentry fund as well as for the S&P 1 0 0 index. ( An easy way to do this is to calculate the correlation between the monthly return series with the same series lagged by one month. ) What type of autocorrelation do you expect for a financial asset? Why? 3 . Consider the autocorrelation for the Fairfield series. Can you offer a story for its value? 4 . What proportion of the monthly returns on the S&P 1 0 0 index is negative? If the S&P 1 0 0 index returns are normally distributed, what would you expect to be the probability of a negative monthly return? Similarly, what proportion of the monthly returns on Fairfield is negative? If the Fairfield returns are normally distributed, what would you expect to be the probability of a negative monthly return? 5 . Plot the cumulative performance of investing $ 1 0 0 in the Fairfield Sentry fund and the S&P 1 0 0 index over the period from December 1 9 9 0 – October 2 0 0 8 . 6 . Create a histogram of the distribution of the Fairfield Sentry fund and S&P 1 0 0 monthly returns. Please comment on how you would characterize these return distributions. ( I . e . , normal, symmetric, skewed, fat - tailed, etc. ) 7 . Does a severe violation from normality provide evidence of fraud?Monthly Returns Fairfield 5&P100 Nov-90 Dec-90 0,0277 0,01866 Jan-91 0,0301 0,05122 Feb-91 0,014 0,07302 Mar-91 0,0052 0,02307 Apr-91 0,0132 0,00137 May-91 0,0182 0,04603 Jun-91 0,003 -0,04381 Jul-91 0,0198 0,0494 Aug-91 0,01 0,01346 Sep-91 0,0073 -0,02316 Oct-91 0,0275 0,0124 Nov-91 0,0001 -0,04001 Dec-91 0,0156 0,09829 Jan-92 0,0042 -0,01312 Feb-92 0,0272 0,01632 Mar-92 0,0094 -0,01626 Apr-92 0,0279 0,03227 May-92 -0,0027 0,00709 Jun-92 0,0122 -0,01513 Jul-92 -0,0009 0,03214 Aug-92 0,0085 -0,02491 Sep-92 0,0033 0,00212 Oct-92 0,0133 -0,00344. Nov-92 0,0135 0,03082 Dec-92 0,0136 0,0121 Jan-93 -0,0009 0,01349 Feb-93 0,0186 0,01868 Mar-93 0,0179 0,01907 Apr-93 -0,0001 -0,01675 May-93 0,0165 0,0293 Jun-93 0,0079 0,00039 Jul-93 0,0002 -0,00477 Aug-93 0,0171 0,03711 Sep-93 0,0028 -0,01322 Oct-93 0,0171 0,01625 Nov-93 0,0019 -0,00218 Dec-93 0,0039 0,01067 Jan-94 0,0211 0,03889 Feb-94 -0,0044 -0,02354. Mar-94 0,0145 -0,04708 Apr-94 0,0175 0,00748 May-94 0,0044 0,02476 Jun-94 0,0023 -0,02954. Jul-94 0,0171 0,03711 Aug-94 0,0035 0,03272 Sep-94 0,0075 -0,01927 Oct-94 0,0181 0,02378 Nov-94 -0,0064 -0,03373 Dec-94 0,006 0,01954 Jan-95 0,0085 0,01975 Feb-95 0,0069 0,04679 Mar-95 0,0078 0,03317 Apr-95 0,0162 0,03949 May-95 0,0165 0,0436 Jun-95 0,0043 0,02315 Jul-95 0,0102 0,0335 Aug-95 -0,0024 -0,00514. Sep-95 0,0163 0,05027 Oct-95 0,0153 0,00071 Nov-95 0,0044 0,04158 Dec-95 0,0103 0,01676 Jan-96 0,0142 0,04219 Feb-96 0,0066 0,0141 Mar-96 0,016 0,0102 Apr-96 0,0057 0,01431 May-96 0,0134 0,02724 Jun-96 0,0015 0,00386 Jul-96 0,0186 -0,04673 Aug-96 0,002 0,02396 Sep-96 0,016 0,05307 Oct-96 0,0103 0,0298 Nov-96 0,0151 0,07973 Dec-96 0,0041 -0,01641 Jan-97 0,0238 0,07286 Feb-97 0,0067 -0,00227 Mar-97 0,008 -0,03907 Apr-97 0,011 0,06686 May-97 0,0057 0,0543 Jun-97 0,0128 0,04303 Jul-97 0,0068 0,08128 Aug-97 0,0028 -0,06413 Sep-97 0,0232 0,05325 Oct-97 0,0049 -0,04326 Nov-97 0,0149 0,05291 Dec-97 0,0036 0,00346 Jan-98 0,0085 0,01988 Feb-98 0,0123 0,07234 Mar-98 0,0168 0,05525 Apr-98 0,0036 0,01504 May-98 0,0169 -0,01246 Jun-98 0,0122 0,04953 Jul-98 0,0076 -0,00558 Aug-98 0,0021 -0,14414. Sep-98 0,0098 0,04878 Oct-98 0,0186 0,0898 Nov-98 0,0078 0,07637 Dec-98 0,0026 0,04787 Jan-99 0,0199 0,06099 Feb-99 0,0011 -0,03329 Mar-99 0,0222 0,047 Apr-99 0,0029 0,04555 May-99 0,0145 -0,02413 Jun-99 0,017 0,07068 Jul-99 0,0036 -0,0293 Aug-99 0,0087 0,0141 Sep-99 0,0066 -0,02746 Oct-99 0,0105 0,067 Nov-99 0,0154 0,03145 Dec-99 0,0032 0,07426 Jan-00 0,0214 -0,04821 Feb-00 0,0013 -0,01965 Mar-00 0,0177 0,10463 Apr-00 0,0027 -0,04075 May-00 0,013 -0,02429 Jun-00 0,0073 0,03825 Jul-00 0,0058 -0,00906 Aug-00 0,0126 0,0585 Sep-00 0,0018 -0,08109 Oct-00 0,0086 -0,01116 Nov-00 0,0062 -0,0702 Dec-00 0,0036 -0,01477 Jan-01 0,0214 0,04265 Feb-01 0,0008 -0,10306 Mar-01 0,0107 -0,07585 Apr-01 0,0126 0,09183 May-01 0,0026 0,00263 Jun-01 0,0017 -0,02153 Jul-01 0,0038 -0,01471 Aug-01 0,0094 -0,07046 Sep-01 0,0066 -0,07583 Oct-01 0,0122 0,02223 Nov-01 0,014 0,075607 Dec-01 0,0012 0,00045 Jan-02 -0,0004 -0,017421 Feb-02 0,0053 -0,017777 Mar-02 0,0039 0,028313 Apr-02 0,0109 -0,07793 May-02 0,0205 -0,004532 Jun-02 0,0019 -0,072408 Jul-02 0,0329 -0,06272 Aug-02 -0,0013 0,005817 Sep-02 0,0006 -0,114667 Oct-02 0,0066 0,109593 Nov-02 0,0009 0,062927 Dec-02 0 -0,069364 Jan-03 -0,0035 -0,026026 Feb-03 -0,0005 -0,014714 Mar-03 0,0185 0,010329 Apr-03 0,0003 0,086057 May-03 0,009 0,039837 Jun-03 0,0093 0,016502 Jul-03 0,0137 0,019596 Aug-03 0,0016 0,009741 Sep-03 0,0086 -0,007952 Oct-03 0,0126 0,044872 Nov-03 -0,0014 0,0031 Dec-03 0,0025 0,059641 Jan-04 0,0088 0,018487 Feb-04 0,0044 0,009323 Mar-04 -0,0001 -0,022369 Apr-04 0,0037 -0,017405 May-04 0,0059 0,009524. Jun-04 0,0121 0,017763 Jul-04 0,0002 -0,027962 Aug-04 0,0126 0,003886 Sep-04 0,0046 -0,005534 Oct-04 0,0003 0,012173 Nov-04 0,0079 0,033071 Dec-04 0,0024 0,033798 Jan-05 0,0051 -0,01714. Feb-05 0,0037 0,01941 Mar-05 0,0085 -0,020288 Apr-05 0,0014 -0,014903 May-05 0,0063 0,023477 Jun-05 0,0046 -0,009781 Jul-05 0,0013 0,027423 Aug-05 0,0016 -0,011799 Sep-05 0,0089 0,005348 Oct-05 0,0161 -0,016595 Nov-05 0,0075 0,035313 Dec-05 0,0054 -0,006654 Jan-06 0,007 0,016492 Feb-06 0,002 0,006474. Mar-06 0,0131 0,013396 Apr-06 0,0094 0,015425 May-06 0,007 -0,021972 Jun-06 0,0051 -0,001551 Jul-06 0,0106 0,017025 Aug-06 0,0077 0,025851 Sep-06 0,0068 0,031122 Oct-06 0,0042 0,03423 Nov-06 0,0086 0,017434. Dec-06 0,0086 0,017966 Jan-07 0,0029 0,010901 Feb-07 -0,0011 -0,031554 Mar-07 0,0164 0,010635 Apr-07 0,0098 0,048493 May-07 0,0081 0,035046 Jun-07 0,0034 -0,012532 Jul-07 0,0017 -0,023417 Aug-07 0,0031 0,019935 Sep-07 0,0097 0,041083 Oct-07 0,0046 0,015118 Nov-07 0,0104 -0,042066 Dec-07 0,0023 -0,007432 Jan-08 0,0063 -0,060655 Feb-08 0,0006 -0,042984 Mar-08 0,0018 0,001809 Apr-08 0,0093 0,045912 May-08 0,0081 -0,000205 Jun-08 -0,0006 -0,088973 Jul-08 0,0072 0,006844. Aug-08 0,0071 0,014414. Sep-08 0,005 -0,076095 Oct-08 -0,0006 -0,145968
Question:
Give step-by-step solution with explanation and final answer:
I urgently need an excel done for this following questions with the attached excel figures. The spreadsheet Return
_
data.xlsx contains monthly returns
(
total returns
)
for the Fairfield Sentry fund and the S&P
1
0
0
index. The Fairfield Sentry fund is not randomly picked. I suggest that you get a sense of what happened to it before doing this assignment. For both return series, perform the following analysis.
1
.
Create a table that provides estimates for their
(
annualized
)
means, variances, standard deviations, covariances and correlations.
2
.
An autocorrelation is the correlation between a return and its previous return. Calculate the monthly autocorrelation for the Fairfield Sentry fund as well as for the S&P
1
0
0
index.
(
An easy way to do this is to calculate the correlation between the monthly return series with the same series lagged by one month.
)
What type of autocorrelation do you expect for a financial asset? Why?
3
.
Consider the autocorrelation for the Fairfield series. Can you offer a story for its value?
4
.
What proportion of the monthly returns on the S&P
1
0
0
index is negative? If the S&P
1
0
0
index returns are normally distributed, what would you expect to be the probability of a negative monthly return? Similarly, what proportion of the monthly returns on Fairfield is negative? If the Fairfield returns are normally distributed, what would you expect to be the probability of a negative monthly return?
5
.
Plot the cumulative performance of investing $
1
0
0
in the Fairfield Sentry fund and the S&P
1
0
0
index over the period from December
1
9
9
0
–
October
2
0
0
8
.
6
.
Create a histogram of the distribution of the Fairfield Sentry fund and S&P
1
0
0
monthly returns. Please comment on how you would characterize these return distributions.
(
I
.
e
.
,
normal, symmetric, skewed, fat
-
tailed, etc.
)
7
.
Does a severe violation from normality provide evidence of fraud?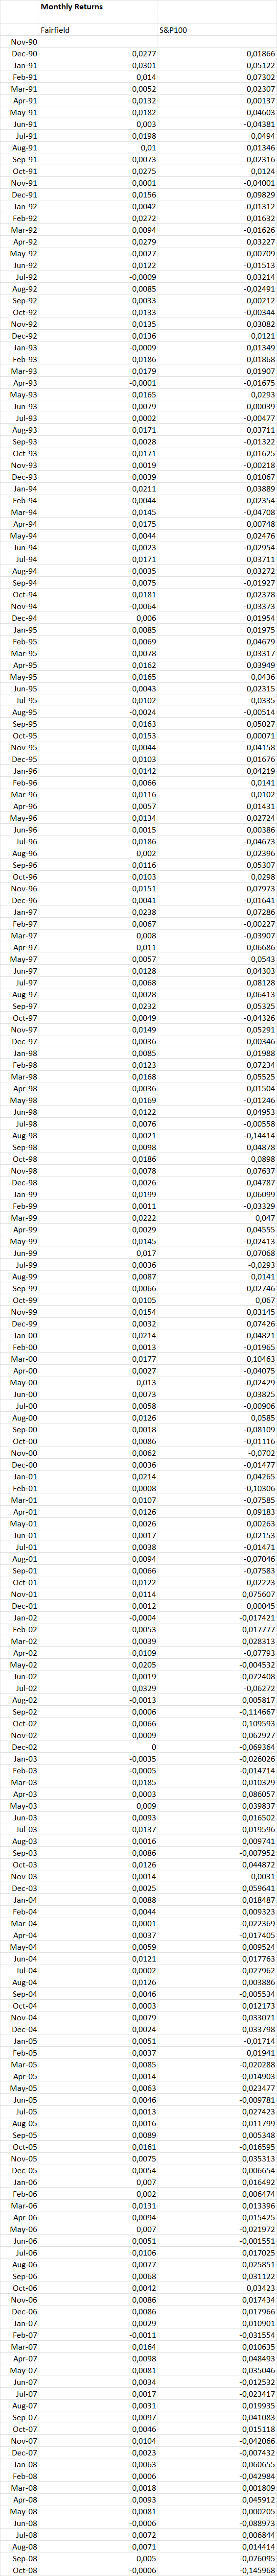 Monthly Returns
Fairfield 5&P100
Nov-90
Dec-90 0,0277 0,01866
Jan-91 0,0301 0,05122
Feb-91 0,014 0,07302
Mar-91 0,0052 0,02307
Apr-91 0,0132 0,00137
May-91 0,0182 0,04603
Jun-91 0,003 -0,04381
Jul-91 0,0198 0,0494
Aug-91 0,01 0,01346
Sep-91 0,0073 -0,02316
Oct-91 0,0275 0,0124
Nov-91 0,0001 -0,04001
Dec-91 0,0156 0,09829
Jan-92 0,0042 -0,01312
Feb-92 0,0272 0,01632
Mar-92 0,0094 -0,01626
Apr-92 0,0279 0,03227
May-92 -0,0027 0,00709
Jun-92 0,0122 -0,01513
Jul-92 -0,0009 0,03214
Aug-92 0,0085 -0,02491
Sep-92 0,0033 0,00212
Oct-92 0,0133 -0,00344.
Nov-92 0,0135 0,03082
Dec-92 0,0136 0,0121
Jan-93 -0,0009 0,01349
Feb-93 0,0186 0,01868
Mar-93 0,0179 0,01907
Apr-93 -0,0001 -0,01675
May-93 0,0165 0,0293
Jun-93 0,0079 0,00039
Jul-93 0,0002 -0,00477
Aug-93 0,0171 0,03711
Sep-93 0,0028 -0,01322
Oct-93 0,0171 0,01625
Nov-93 0,0019 -0,00218
Dec-93 0,0039 0,01067
Jan-94 0,0211 0,03889
Feb-94 -0,0044 -0,02354.
Mar-94 0,0145 -0,04708
Apr-94 0,0175 0,00748
May-94 0,0044 0,02476
Jun-94 0,0023 -0,02954.
Jul-94 0,0171 0,03711
Aug-94 0,0035 0,03272
Sep-94 0,0075 -0,01927
Oct-94 0,0181 0,02378
Nov-94 -0,0064 -0,03373
Dec-94 0,006 0,01954
Jan-95 0,0085 0,01975
Feb-95 0,0069 0,04679
Mar-95 0,0078 0,03317
Apr-95 0,0162 0,03949
May-95 0,0165 0,0436
Jun-95 0,0043 0,02315
Jul-95 0,0102 0,0335
Aug-95 -0,0024 -0,00514.
Sep-95 0,0163 0,05027
Oct-95 0,0153 0,00071
Nov-95 0,0044 0,04158
Dec-95 0,0103 0,01676
Jan-96 0,0142 0,04219
Feb-96 0,0066 0,0141
Mar-96 0,016 0,0102
Apr-96 0,0057 0,01431
May-96 0,0134 0,02724
Jun-96 0,0015 0,00386
Jul-96 0,0186 -0,04673
Aug-96 0,002 0,02396
Sep-96 0,016 0,05307
Oct-96 0,0103 0,0298
Nov-96 0,0151 0,07973
Dec-96 0,0041 -0,01641
Jan-97 0,0238 0,07286
Feb-97 0,0067 -0,00227
Mar-97 0,008 -0,03907
Apr-97 0,011 0,06686
May-97 0,0057 0,0543
Jun-97 0,0128 0,04303
Jul-97 0,0068 0,08128
Aug-97 0,0028 -0,06413
Sep-97 0,0232 0,05325
Oct-97 0,0049 -0,04326
Nov-97 0,0149 0,05291
Dec-97 0,0036 0,00346
Jan-98 0,0085 0,01988
Feb-98 0,0123 0,07234
Mar-98 0,0168 0,05525
Apr-98 0,0036 0,01504
May-98 0,0169 -0,01246
Jun-98 0,0122 0,04953
Jul-98 0,0076 -0,00558
Aug-98 0,0021 -0,14414.
Sep-98 0,0098 0,04878
Oct-98 0,0186 0,0898
Nov-98 0,0078 0,07637
Dec-98 0,0026 0,04787
Jan-99 0,0199 0,06099
Feb-99 0,0011 -0,03329
Mar-99 0,0222 0,047
Apr-99 0,0029 0,04555
May-99 0,0145 -0,02413
Jun-99 0,017 0,07068
Jul-99 0,0036 -0,0293
Aug-99 0,0087 0,0141
Sep-99 0,0066 -0,02746
Oct-99 0,0105 0,067
Nov-99 0,0154 0,03145
Dec-99 0,0032 0,07426
Jan-00 0,0214 -0,04821
Feb-00 0,0013 -0,01965
Mar-00 0,0177 0,10463
Apr-00 0,0027 -0,04075
May-00 0,013 -0,02429
Jun-00 0,0073 0,03825
Jul-00 0,0058 -0,00906
Aug-00 0,0126 0,0585
Sep-00 0,0018 -0,08109
Oct-00 0,0086 -0,01116
Nov-00 0,0062 -0,0702
Dec-00 0,0036 -0,01477
Jan-01 0,0214 0,04265
Feb-01 0,0008 -0,10306
Mar-01 0,0107 -0,07585
Apr-01 0,0126 0,09183
May-01 0,0026 0,00263
Jun-01 0,0017 -0,02153
Jul-01 0,0038 -0,01471
Aug-01 0,0094 -0,07046
Sep-01 0,0066 -0,07583
Oct-01 0,0122 0,02223
Nov-01 0,014 0,075607
Dec-01 0,0012 0,00045
Jan-02 -0,0004 -0,017421
Feb-02 0,0053 -0,017777
Mar-02 0,0039 0,028313
Apr-02 0,0109 -0,07793
May-02 0,0205 -0,004532
Jun-02 0,0019 -0,072408
Jul-02 0,0329 -0,06272
Aug-02 -0,0013 0,005817
Sep-02 0,0006 -0,114667
Oct-02 0,0066 0,109593
Nov-02 0,0009 0,062927
Dec-02 0 -0,069364
Jan-03 -0,0035 -0,026026
Feb-03 -0,0005 -0,014714
Mar-03 0,0185 0,010329
Apr-03 0,0003 0,086057
May-03 0,009 0,039837
Jun-03 0,0093 0,016502
Jul-03 0,0137 0,019596
Aug-03 0,0016 0,009741
Sep-03 0,0086 -0,007952
Oct-03 0,0126 0,044872
Nov-03 -0,0014 0,0031
Dec-03 0,0025 0,059641
Jan-04 0,0088 0,018487
Feb-04 0,0044 0,009323
Mar-04 -0,0001 -0,022369
Apr-04 0,0037 -0,017405
May-04 0,0059 0,009524.
Jun-04 0,0121 0,017763
Jul-04 0,0002 -0,027962
Aug-04 0,0126 0,003886
Sep-04 0,0046 -0,005534
Oct-04 0,0003 0,012173
Nov-04 0,0079 0,033071
Dec-04 0,0024 0,033798
Jan-05 0,0051 -0,01714.
Feb-05 0,0037 0,01941
Mar-05 0,0085 -0,020288
Apr-05 0,0014 -0,014903
May-05 0,0063 0,023477
Jun-05 0,0046 -0,009781
Jul-05 0,0013 0,027423
Aug-05 0,0016 -0,011799
Sep-05 0,0089 0,005348
Oct-05 0,0161 -0,016595
Nov-05 0,0075 0,035313
Dec-05 0,0054 -0,006654
Jan-06 0,007 0,016492
Feb-06 0,002 0,006474.
Mar-06 0,0131 0,013396
Apr-06 0,0094 0,015425
May-06 0,007 -0,021972
Jun-06 0,0051 -0,001551
Jul-06 0,0106 0,017025
Aug-06 0,0077 0,025851
Sep-06 0,0068 0,031122
Oct-06 0,0042 0,03423
Nov-06 0,0086 0,017434.
Dec-06 0,0086 0,017966
Jan-07 0,0029 0,010901
Feb-07 -0,0011 -0,031554
Mar-07 0,0164 0,010635
Apr-07 0,0098 0,048493
May-07 0,0081 0,035046
Jun-07 0,0034 -0,012532
Jul-07 0,0017 -0,023417
Aug-07 0,0031 0,019935
Sep-07 0,0097 0,041083
Oct-07 0,0046 0,015118
Nov-07 0,0104 -0,042066
Dec-07 0,0023 -0,007432
Jan-08 0,0063 -0,060655
Feb-08 0,0006 -0,042984
Mar-08 0,0018 0,001809
Apr-08 0,0093 0,045912
May-08 0,0081 -0,000205
Jun-08 -0,0006 -0,088973
Jul-08 0,0072 0,006844.
Aug-08 0,0071 0,014414.
Sep-08 0,005 -0,076095
Oct-08 -0,0006 -0,145968
Monthly Returns
Fairfield 5&P100
Nov-90
Dec-90 0,0277 0,01866
Jan-91 0,0301 0,05122
Feb-91 0,014 0,07302
Mar-91 0,0052 0,02307
Apr-91 0,0132 0,00137
May-91 0,0182 0,04603
Jun-91 0,003 -0,04381
Jul-91 0,0198 0,0494
Aug-91 0,01 0,01346
Sep-91 0,0073 -0,02316
Oct-91 0,0275 0,0124
Nov-91 0,0001 -0,04001
Dec-91 0,0156 0,09829
Jan-92 0,0042 -0,01312
Feb-92 0,0272 0,01632
Mar-92 0,0094 -0,01626
Apr-92 0,0279 0,03227
May-92 -0,0027 0,00709
Jun-92 0,0122 -0,01513
Jul-92 -0,0009 0,03214
Aug-92 0,0085 -0,02491
Sep-92 0,0033 0,00212
Oct-92 0,0133 -0,00344.
Nov-92 0,0135 0,03082
Dec-92 0,0136 0,0121
Jan-93 -0,0009 0,01349
Feb-93 0,0186 0,01868
Mar-93 0,0179 0,01907
Apr-93 -0,0001 -0,01675
May-93 0,0165 0,0293
Jun-93 0,0079 0,00039
Jul-93 0,0002 -0,00477
Aug-93 0,0171 0,03711
Sep-93 0,0028 -0,01322
Oct-93 0,0171 0,01625
Nov-93 0,0019 -0,00218
Dec-93 0,0039 0,01067
Jan-94 0,0211 0,03889
Feb-94 -0,0044 -0,02354.
Mar-94 0,0145 -0,04708
Apr-94 0,0175 0,00748
May-94 0,0044 0,02476
Jun-94 0,0023 -0,02954.
Jul-94 0,0171 0,03711
Aug-94 0,0035 0,03272
Sep-94 0,0075 -0,01927
Oct-94 0,0181 0,02378
Nov-94 -0,0064 -0,03373
Dec-94 0,006 0,01954
Jan-95 0,0085 0,01975
Feb-95 0,0069 0,04679
Mar-95 0,0078 0,03317
Apr-95 0,0162 0,03949
May-95 0,0165 0,0436
Jun-95 0,0043 0,02315
Jul-95 0,0102 0,0335
Aug-95 -0,0024 -0,00514.
Sep-95 0,0163 0,05027
Oct-95 0,0153 0,00071
Nov-95 0,0044 0,04158
Dec-95 0,0103 0,01676
Jan-96 0,0142 0,04219
Feb-96 0,0066 0,0141
Mar-96 0,016 0,0102
Apr-96 0,0057 0,01431
May-96 0,0134 0,02724
Jun-96 0,0015 0,00386
Jul-96 0,0186 -0,04673
Aug-96 0,002 0,02396
Sep-96 0,016 0,05307
Oct-96 0,0103 0,0298
Nov-96 0,0151 0,07973
Dec-96 0,0041 -0,01641
Jan-97 0,0238 0,07286
Feb-97 0,0067 -0,00227
Mar-97 0,008 -0,03907
Apr-97 0,011 0,06686
May-97 0,0057 0,0543
Jun-97 0,0128 0,04303
Jul-97 0,0068 0,08128
Aug-97 0,0028 -0,06413
Sep-97 0,0232 0,05325
Oct-97 0,0049 -0,04326
Nov-97 0,0149 0,05291
Dec-97 0,0036 0,00346
Jan-98 0,0085 0,01988
Feb-98 0,0123 0,07234
Mar-98 0,0168 0,05525
Apr-98 0,0036 0,01504
May-98 0,0169 -0,01246
Jun-98 0,0122 0,04953
Jul-98 0,0076 -0,00558
Aug-98 0,0021 -0,14414.
Sep-98 0,0098 0,04878
Oct-98 0,0186 0,0898
Nov-98 0,0078 0,07637
Dec-98 0,0026 0,04787
Jan-99 0,0199 0,06099
Feb-99 0,0011 -0,03329
Mar-99 0,0222 0,047
Apr-99 0,0029 0,04555
May-99 0,0145 -0,02413
Jun-99 0,017 0,07068
Jul-99 0,0036 -0,0293
Aug-99 0,0087 0,0141
Sep-99 0,0066 -0,02746
Oct-99 0,0105 0,067
Nov-99 0,0154 0,03145
Dec-99 0,0032 0,07426
Jan-00 0,0214 -0,04821
Feb-00 0,0013 -0,01965
Mar-00 0,0177 0,10463
Apr-00 0,0027 -0,04075
May-00 0,013 -0,02429
Jun-00 0,0073 0,03825
Jul-00 0,0058 -0,00906
Aug-00 0,0126 0,0585
Sep-00 0,0018 -0,08109
Oct-00 0,0086 -0,01116
Nov-00 0,0062 -0,0702
Dec-00 0,0036 -0,01477
Jan-01 0,0214 0,04265
Feb-01 0,0008 -0,10306
Mar-01 0,0107 -0,07585
Apr-01 0,0126 0,09183
May-01 0,0026 0,00263
Jun-01 0,0017 -0,02153
Jul-01 0,0038 -0,01471
Aug-01 0,0094 -0,07046
Sep-01 0,0066 -0,07583
Oct-01 0,0122 0,02223
Nov-01 0,014 0,075607
Dec-01 0,0012 0,00045
Jan-02 -0,0004 -0,017421
Feb-02 0,0053 -0,017777
Mar-02 0,0039 0,028313
Apr-02 0,0109 -0,07793
May-02 0,0205 -0,004532
Jun-02 0,0019 -0,072408
Jul-02 0,0329 -0,06272
Aug-02 -0,0013 0,005817
Sep-02 0,0006 -0,114667
Oct-02 0,0066 0,109593
Nov-02 0,0009 0,062927
Dec-02 0 -0,069364
Jan-03 -0,0035 -0,026026
Feb-03 -0,0005 -0,014714
Mar-03 0,0185 0,010329
Apr-03 0,0003 0,086057
May-03 0,009 0,039837
Jun-03 0,0093 0,016502
Jul-03 0,0137 0,019596
Aug-03 0,0016 0,009741
Sep-03 0,0086 -0,007952
Oct-03 0,0126 0,044872
Nov-03 -0,0014 0,0031
Dec-03 0,0025 0,059641
Jan-04 0,0088 0,018487
Feb-04 0,0044 0,009323
Mar-04 -0,0001 -0,022369
Apr-04 0,0037 -0,017405
May-04 0,0059 0,009524.
Jun-04 0,0121 0,017763
Jul-04 0,0002 -0,027962
Aug-04 0,0126 0,003886
Sep-04 0,0046 -0,005534
Oct-04 0,0003 0,012173
Nov-04 0,0079 0,033071
Dec-04 0,0024 0,033798
Jan-05 0,0051 -0,01714.
Feb-05 0,0037 0,01941
Mar-05 0,0085 -0,020288
Apr-05 0,0014 -0,014903
May-05 0,0063 0,023477
Jun-05 0,0046 -0,009781
Jul-05 0,0013 0,027423
Aug-05 0,0016 -0,011799
Sep-05 0,0089 0,005348
Oct-05 0,0161 -0,016595
Nov-05 0,0075 0,035313
Dec-05 0,0054 -0,006654
Jan-06 0,007 0,016492
Feb-06 0,002 0,006474.
Mar-06 0,0131 0,013396
Apr-06 0,0094 0,015425
May-06 0,007 -0,021972
Jun-06 0,0051 -0,001551
Jul-06 0,0106 0,017025
Aug-06 0,0077 0,025851
Sep-06 0,0068 0,031122
Oct-06 0,0042 0,03423
Nov-06 0,0086 0,017434.
Dec-06 0,0086 0,017966
Jan-07 0,0029 0,010901
Feb-07 -0,0011 -0,031554
Mar-07 0,0164 0,010635
Apr-07 0,0098 0,048493
May-07 0,0081 0,035046
Jun-07 0,0034 -0,012532
Jul-07 0,0017 -0,023417
Aug-07 0,0031 0,019935
Sep-07 0,0097 0,041083
Oct-07 0,0046 0,015118
Nov-07 0,0104 -0,042066
Dec-07 0,0023 -0,007432
Jan-08 0,0063 -0,060655
Feb-08 0,0006 -0,042984
Mar-08 0,0018 0,001809
Apr-08 0,0093 0,045912
May-08 0,0081 -0,000205
Jun-08 -0,0006 -0,088973
Jul-08 0,0072 0,006844.
Aug-08 0,0071 0,014414.
Sep-08 0,005 -0,076095
Oct-08 -0,0006 -0,145968
Asked by: Sahab Sharan
Created at: 2025-09-28 09:23:15
Final Answer:
📢 Instructions:
- Ask anything relatd to above question only.
- For new Question goto :