Give step-by-step solution with explanation and final answer:1. Estimate the queue dissipation time, maximum queue length, and total delay, given: 3:00-3:30 PM 3:30-4:00 PM 4:00 - 8:00 PM Arrival Rate (veh/hour/lane) 1500 [900 ~~ [1200 Departure Rate (veh/hour/lane) [900 [1200 ~~ [1so0 |
Question:
Give step-by-step solution with explanation and final answer: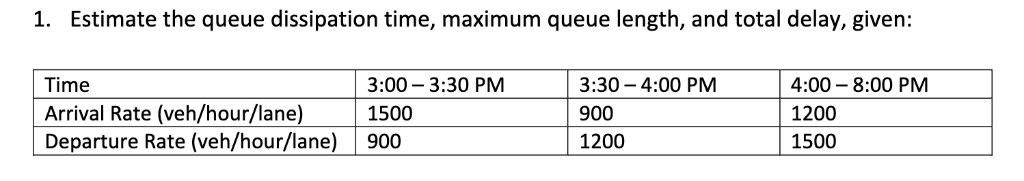 1. Estimate the queue dissipation time, maximum queue length, and total delay, given:
3:00-3:30 PM 3:30-4:00 PM 4:00 - 8:00 PM
Arrival Rate (veh/hour/lane) 1500 [900 ~~ [1200
Departure Rate (veh/hour/lane) [900 [1200 ~~ [1so0 |
1. Estimate the queue dissipation time, maximum queue length, and total delay, given:
3:00-3:30 PM 3:30-4:00 PM 4:00 - 8:00 PM
Arrival Rate (veh/hour/lane) 1500 [900 ~~ [1200
Departure Rate (veh/hour/lane) [900 [1200 ~~ [1so0 |
This is AI generated Response.
Asked by: Sanju
Created at: 2025-09-29 14:34:04
Asked by: Sanju
Created at: 2025-09-29 14:34:04
Final Answer:
Rendered
Raw Text
Did you like this answer?
Let's solve the problem step by step for **queue dissipation time**, **maximum queue length**, and **total delay**.
---
## **Step 1: Calculate Net Queue Growth per Interval**
| Interval | Arrival Rate | Departure Rate | Net Change (veh/hr) | Duration (hr) |
|--------------------|--------------|----------------|---------------------|---------------|
| 3:00 – 3:30 PM | 150 | 900 | +600 | .5 |
| 3:30 – 4:00 PM | 900 | 120 | -300 | .5 |
| 4:00 – 8:00 PM | 120 | 150 | -300 | 4 |
- **Net Change = Arrival Rate - Departure Rate**
- **Positive:** Queue builds up.
- **Negative:** Queue dissipates.
---
## **Step 2: Compute Queue Length Over Time**
### **Interval 1: 3:00 – 3:30 PM**
- Net Change: **+600 veh/hr**
- In .5 hr:
\[
\text{Queue Increase} = 600 \times .5 = 300~\text{vehicles}
\]
- **At 3:30 PM:** Queue = **300 vehicles**
### **Interval 2: 3:30 – 4:00 PM**
- Net Change: **-300 veh/hr**
- In .5 hr:
\[
\text{Queue Decrease} = 300 \times .5 = 150~\text{vehicles}
\]
- **At 4:00 PM:**
\[
\text{Queue} = 300 - 150 = 150~\text{vehicles}
\]
### **Interval 3: 4:00 – 8:00 PM**
- Net Change: **-300 veh/hr**
- Initial Queue: **150 vehicles**
- Time to dissipate:
\[
\text{Time to clear} = \frac{150}{300} = .5~\text{hr} = 30~\text{min}
\]
- **Queue clears at 4:30 PM**
---
## **Step 3: Final Answers**
### **A. Maximum Queue Length**
- Occurs at **3:30 PM**
- **Maximum Queue:** **300 vehicles**
### **B. Queue Dissipation Time**
- Queue is gone by **4:30 PM**
- **Dissipation Time:** **4:30 PM**
### **C. Total Delay (Vehicle-Hours)**
Total delay is the area under the queue vs. time curve (sum of vehicle-seconds/vehicle-hours spent waiting in queue):
#### **Interval 1 (3:00–3:30 PM):**
- Triangle:
\[
\text{Area} = \frac{1}{2} \times .5~\text{hr} \times 300~\text{veh} = 75~\text{veh-hr}
\]
#### **Interval 2 (3:30–4:00 PM):**
- Trapezoid from 300 to 150 vehicles:
\[
\text{Area} = \frac{1}{2} \times (300 + 150) \times .5~\text{hr} = 112.5~\text{veh-hr}
\]
#### **Interval 3 (4:00–4:30 PM):**
- Triangle from 150 to vehicles over .5 hr:
\[
\text{Area} = \frac{1}{2} \times .5~\text{hr} \times 150~\text{veh} = 37.5~\text{veh-hr}
\]
#### **Sum:**
\[
\text{Total Delay} = 75 + 112.5 + 37.5 = \boxed{225~\text{vehicle-hours}}
\]
---
## **Summary Table**
| Quantity | Value |
|--------------------------|-------------------------|
| **Max Queue Length** | 300 vehicles |
| **Queue Dissipation Time** | 4:30 PM |
| **Total Delay** | 225 vehicle-hours |
---
### **Explanation**
- Queue **builds up** when arrivals > departures, **dissipates** when arrivals < departures.
- **Total delay** is the sum of all vehicle-hours spent in the queue until it is cleared.
---
Let me know if you need a diagram or further breakdown!
📢 Instructions:
- Ask anything relatd to above question only.
- For new Question goto :