This is AI generated Response.
Asked by: nayan
Created at: 2026-02-24 08:25:15
Final Answer:
RenderedRaw Text
Did you like this answer?
# Given Information
- Four distributions (a), (b), (c), and (d) are shown as histograms.
- Each histogram represents 9 measurements.
- We are to order their respective means: μₐ, μ_b, μ_c, and μ_d, from smallest to largest.
# What We Have to Find
- The correct order of the means (μ) of the four distributions, from smallest to largest.
# Definition or Concept Used
- **Mean of a distribution**: The mean (average) is the sum of all measurements divided by the number of measurements. In histograms, the mean will be pulled toward higher values if there are more or higher bars on the right, and toward lower values if there are more or higher bars on the left.
# Step-by-Step Solution
First, observe the distribution of measurements in each histogram:
- **(a):** The bars are spread out, with noticeable counts at higher values (11–13) and some at lower values (2–4).
- **(b):** Similar to (a), but slightly more weight toward lower values (bars at 2–4 are higher than 11–13).
- **(c):** The highest bars are at the lowest values (2–4), with one high bar at 12 and little in the middle.
- **(d):** The bars are mostly concentrated at lower values (2–7), with only one high bar at 11–13.
Now, compare the means:
- **(c)** has most data at lower values (2–4) and one at 12, so its mean will be lowest.
- **(d)** has all data at lower values (2–7) and one at 11–13, so its mean will be higher than (c) but lower than (b) and (a).
- **(b)** has more data at lower values but also some at higher values, so its mean will be higher than (d) but less than (a).
- **(a)** has a more even spread and strong high-value bars, pushing its mean the highest.
# Summary
μ_c < μ_d < μ_b < μ_a
Question:
its incorrect solve avgain
This is AI generated Response.
Asked by: nayan
Created at: 2026-02-24 08:28:30
Final Answer:
RenderedRaw Text
Did you like this answer?
# Given Information
- Four distributions (a), (b), (c), and (d) are represented through histograms.
- Each histogram consists of 9 measurements.
- We aim to order the means (μ) of these distributions from smallest to largest.
# What We Have to Find
- The ordered means (μₐ, μ_b, μ_c, μ_d) from smallest to largest.
# Definition or Concept Used
- **Mean of a distribution**: The mean (average) is calculated as the sum of all values divided by the number of values. In histograms, the mean can be inferred based on the distribution and height of the bars; higher values in the histogram tend to pull the mean higher.
# Step-by-Step Solution
Examine the histograms for each distribution:
- **Distribution (a)**: Shows a balanced spread with significant counts near higher values (e.g., 10-12).
- **Distribution (b)**: Similar to (a) but slightly skewed towards lower values, with more counts between 4-8 compared to (10-12).
- **Distribution (c)**: Predominantly has counts in the lowest range (2-4) with fewer higher values (rarely reaches above 10).
- **Distribution (d)**: Mostly concentrated on lower values (2-6), with only a few measurements reaching higher values (max 10).
Assessing the means:
- **(c)** clearly shows the lowest mean since most values are concentrated at the lower end.
- **(d)** has a higher mean than (c), as it has more values at 4-6 but still lower than the others.
- **(b)** has a mix of lower values but includes significant higher counts, leading to a higher mean than (d).
- **(a)** has the highest mean due to a more uniform distribution across higher values.
# Summary
μ_c < μ_d < μ_b < μ_a
Question:
correct solyution is : GIVEN INFORMATION
Four histograms labeled (a), (b), (c), and (d).
Each distribution contains 9 measurements.
We must compare their means without doing calculations.
WHAT HAS TO BE FOUND
Arrange the means in increasing order:
?
?
,
?
?
,
?
?
,
?
?
μ
a
, μ
b
, μ
c
, μ
d
CONCEPT USED
The mean represents the balance point of a distribution.
Since each histogram has the same number of observations:
• The distribution whose data are centered further to the right has a larger mean.
• The distribution centered further to the left has a smaller mean.
• A few extreme large values can increase the mean more strongly than moderate clustering.
So we compare how far right the “center of mass” of each histogram lies.
CAREFUL VISUAL ANALYSIS
Distribution (c) has most of its observations concentrated on the left side with only a small number of higher values. Its overall balance point is the furthest left. Hence, it has the smallest mean.
Distribution (a) is slightly shifted to the right compared to (c), but still not as right-heavy as (d) or (b). So its mean is larger than (c) but smaller than the remaining two.
Distribution (d) has several high values, but its overall mass is not as far right as (b). Its center is between (a) and (b).
Distribution (b) clearly has more weight toward the highest values overall, placing its balance point furthest to the right. Therefore, it has the largest mean.
Thus, ordering from smallest to largest:
?
?
<
?
?
<
?
?
<
?
?
μ
c
This is AI generated Response.
Asked by: nayan
Created at: 2026-02-24 08:30:48
Final Answer:
RenderedRaw Text
Did you like this answer?
# Given Information
- Four histograms labeled (a), (b), (c), and (d).
- Each distribution contains 9 measurements.
- We must compare their means without performing calculations.
# What Has to Be Found
- Arrange the means in increasing order:
\( \mu_a, \mu_b, \mu_c, \mu_d \)
# Concept Used
- **Mean**: Represents the balance point of a distribution.
- Since each histogram has the same number of observations:
- A distribution with data centered further to the right has a larger mean.
- A distribution centered further to the left has a smaller mean.
- Extreme values can heavily influence the mean.
# Careful Visual Analysis
- **Distribution (c)**: Most observations are on the left side, with few higher values, indicating the smallest mean.
- **Distribution (a)**: Slightly right-shifted compared to (c) but not as much as (d) or (b), making its mean larger than (c) but smaller than the others.
- **Distribution (d)**: Contains several high values, but its overall center is not as right as (b), placing its mean between (a) and (b).
- **Distribution (b)**: Has more weight toward higher values, giving it the largest mean.
# Summary
\[
\mu_c < \mu_a < \mu_d < \mu_b
\]
Question:
generat eoen mroe unqiue solution and explainin detail
This is AI generated Response.
Asked by: nayan
Created at: 2026-02-24 08:31:47
Final Answer:
RenderedRaw Text
Did you like this answer?
# Given Information
- Four histograms labeled (a), (b), (c), and (d) represent different distributions.
- Each histogram consists of 9 measurements.
- The objective is to rank the means (μ) of these distributions without performing exact calculations.
# What Has to Be Found
- The means in increasing order:
\( \mu_a, \mu_b, \mu_c, \mu_d \)
# Concept Used
- **Mean of a Distribution**: The mean is the average value that indicates the center of a distribution. In histograms:
- A distribution with its values concentrated toward higher numbers will have a larger mean.
- Conversely, a distribution with values concentrated toward lower numbers will have a smaller mean.
- Extreme high values can disproportionately raise the mean compared to moderate clusters of values.
# Detailed Analysis of Distributions
1. **Distribution (c)**:
- Most values are clustered at the lower end (e.g., between 2 and 4).
- Higher values (e.g., around 10) are sparse.
- This concentration indicates that the mean is the lowest among the four distributions.
2. **Distribution (a)**:
- The data is somewhat spread out, with a moderate presence of values around 5-9 and a few higher values (10-12).
- The balance point is higher than (c) due to the presence of higher values but lower than (b) and (d).
3. **Distribution (d)**:
- This distribution has several high values (e.g., around 9-11), but a significant portion of data is still on the lower side (2-6).
- While it has some high values, the overall center of mass is not as far right as (b), placing its mean higher than (c) and (a) but lower than (b).
4. **Distribution (b)**:
- This histogram displays a strong concentration of values in the higher range (e.g., 8-11) while still having some lower values (4-6).
- It has the most weight toward the higher end, resulting in the largest mean of all the distributions.
# Summary
After analyzing the distributions, we can conclude the order of their means based on the positions of their centers of mass:
\[
\mu_c < \mu_a < \mu_d < \mu_b
\]
This indicates that the mean of distribution (c) is the smallest, followed by (a), then (d), and finally (b) with the largest mean.
Question:
generat eoen mro eunique solution in different wordinfg
This is AI generated Response.
Asked by: nayan
Created at: 2026-02-24 08:32:49
Final Answer:
RenderedRaw Text
Did you like this answer?
# Given Information
- There are four histograms labeled (a), (b), (c), and (d) representing different distributions.
- Each distribution contains a total of 9 measurements.
- The task is to determine the order of their means without performing numerical calculations.
# What Has to Be Found
- The means in increasing order:
\( \mu_a, \mu_b, \mu_c, \mu_d \)
# Concept Used
- **Mean of a Distribution**: The mean serves as the central point of a distribution. In the context of histograms:
- A distribution with values predominantly in higher ranges will yield a larger mean.
- Conversely, if values cluster toward lower ranges, the mean will be smaller.
- The presence of a few extreme high values can significantly elevate the mean more than a consistent distribution.
# In-Depth Assessment of Distributions
1. **Distribution (c)**:
- This histogram shows the majority of observations concentrated in the lower range (e.g., values between 2 and 4).
- Only a few measurements reach higher values, indicating that the mean is likely the lowest among all four distributions.
2. **Distribution (a)**:
- The data is somewhat evenly distributed, with notable counts in the mid-range (5-9) and a few higher values (10-12).
- This balances the mean higher than (c) but not as high as (b) or (d).
3. **Distribution (d)**:
- While this distribution features several high values (e.g., around 9-11), it also has a notable number of lower measurements (2-6).
- Thus, the overall center of mass is positioned higher than (c) and (a) but lower than (b).
4. **Distribution (b)**:
- This histogram is characterized by a strong concentration of values in the higher range (e.g., 8-11), alongside some lower values (4-6).
- The significant weight toward the higher end leads to the largest mean among the distributions.
# Summary
Based on the analysis of how the data is distributed within the histograms, the means are ordered as follows:
\[
\mu_c < \mu_a < \mu_d < \mu_b
\]
This indicates that the mean of distribution (c) is the smallest, followed by (a), with (d) next, and (b) having the largest mean.
Question:
GIVEN INFORMATION
Four histograms labeled (a), (b), (c), and (d) are shown.
Each histogram represents 9 observations.
No calculations are allowed — only visual reasoning.
WHAT IS REQUIRED
Arrange the population means in increasing order:
?
?
,
?
?
,
?
?
,
?
?
μ
a
, μ
b
, μ
c
, μ
d
PRINCIPLE USED
The mean is the arithmetic average and can be interpreted visually as the balancing point of the data.
Because:
• Each distribution has the same number of observations (9).
• The horizontal scale is identical in all four histograms.
We can compare the means simply by observing where most of the data lie along the number line.
Key idea:
If more observations lie at larger values, the mean shifts to the right.
If more observations lie at smaller values, the mean shifts to the left.
Thus, we determine which histogram is most left-centered and which is most right-centered.
DETAILED VISUAL COMPARISON
Distribution (c)
Most of its bars are concentrated toward the lower end of the scale.
Only a small portion of data appears at higher values.
Its mass is clearly positioned furthest left among the four.
Therefore, it has the smallest mean.
Distribution (a)
Compared to (c), it is slightly shifted to the right.
However, it still contains noticeable weight in the lower-middle region.
So its balance point is to the right of (c) but not very far.
Hence, its mean is greater than (c) but smaller than the remaining two.
Distribution (d)
This histogram shows a stronger presence of higher-value observations compared to (a).
Its cluster toward larger numbers shifts its center further right.
However, it is still not as right-heavy as (b).
So its mean lies between (a) and (b).
Distribution (b)
This one has the strongest concentration of observations at the higher end of the scale.
The overall mass is visibly shifted furthest right.
Thus, it has the largest balancing point and therefore the largest mean.
ARRANGING FROM SMALLEST TO LARGEST MEAN
From most left-centered to most right-centered:
(c) → (a) → (d) → (b)
FINAL ANSWER (SUMMARY)
?
?
<
?
?
<
?
?
<
?
?
μ
c
This is AI generated Response.
Asked by: nayan
Created at: 2026-02-24 08:35:58
Final Answer:
RenderedRaw Text
Did you like this answer?
# Given Information
- Four histograms labeled (a), (b), (c), and (d).
- Each histogram represents 9 observations.
- Calculations are not permitted; only visual reasoning is allowed.
# What Is Required
- Arrange the population means in increasing order:
\( \mu_a, \mu_b, \mu_c, \mu_d \)
# Principle Used
- The mean is the arithmetic average and represents the balancing point of the data.
- Since each distribution contains the same number of observations (9) and shares an identical horizontal scale, we can compare the means based solely on the distribution of data.
Key Idea:
- A higher concentration of observations at larger values shifts the mean to the right.
- A higher concentration of observations at smaller values shifts the mean to the left.
# Detailed Visual Comparison
- **Distribution (c)**:
- Most bars are clustered at the lower end of the scale.
- Very few data points appear at higher values.
- Its mass is positioned the furthest left, indicating it has the smallest mean.
- **Distribution (a)**:
- This distribution is slightly shifted to the right compared to (c).
- It contains significant weight in the lower-middle range.
- Thus, its mean is greater than (c) but smaller than the remaining distributions.
- **Distribution (d)**:
- Shows a stronger presence of higher-value observations compared to (a).
- Its center of mass is closer to larger numbers, shifting it further right.
- However, it is not as right-heavy as (b), placing its mean between (a) and (b).
- **Distribution (b)**:
- Characterized by the strongest concentration of observations at the higher end of the scale.
- The overall mass is visibly shifted furthest right, resulting in the largest mean.
# Arranging from Smallest to Largest Mean
Based on the visual analysis, the order from most left-centered to most right-centered is:
\( \mu_c < \mu_a < \mu_d < \mu_b \)
# Final Answer (Summary)
\[
\mu_c < \mu_a < \mu_d < \mu_b
\]
Question:
GIVEN INFORMATION
Four separate histograms labeled (a), (b), (c), and (d) are displayed.
Each histogram represents exactly 9 data values.
All histograms use the same horizontal scale.
OBJECTIVE
Determine the correct increasing order of the means:
?
?
,
?
?
,
?
?
,
?
?
μ
a
, μ
b
, μ
c
, μ
d
No arithmetic computation is allowed. The comparison must be done visually.
UNDERLYING IDEA
The mean of a dataset can be interpreted as its center of gravity on the number line.
Since:
• All four datasets contain the same number of observations,
• The scale is identical in each histogram,
we can compare the means by observing where the bulk of each distribution is located.
Important reasoning rule:
If more observations are located at higher numerical values, the mean increases.
If more observations are located at lower numerical values, the mean decreases.
Thus, the histogram that appears most “right-shifted” has the largest mean, and the one most “left-shifted” has the smallest mean.
CAREFUL VISUAL EVALUATION
Distribution (c)
Most bars appear toward the lower end of the scale.
There are fewer observations in the higher-value region.
Its overall mass lies farthest to the left.
Therefore, it must have the smallest mean.
Distribution (a)
Compared to (c), its data are slightly shifted rightward.
However, it still retains a noticeable concentration in the mid-to-lower range.
Thus, its mean is larger than that of (c), but not among the largest overall.
Distribution (d)
This histogram shows a clear presence of higher values and is positioned further to the right than (a).
Its center of mass is therefore greater than that of (a).
However, when compared to (b), it does not extend as strongly into the highest range.
So its mean lies between (a) and (b).
Distribution (b)
This distribution shows the strongest rightward concentration.
The majority of its observations lie in the higher-value region.
Hence, its balance point is furthest to the right, making its mean the largest.
ORDERING THE MEANS
From smallest to largest:
?
?
<
?
?
<
?
?
<
?
?
μ
c
This is AI generated Response.
Asked by: nayan
Created at: 2026-02-24 08:39:49
Final Answer:
RenderedRaw Text
Did you like this answer?
# Given Information
- Four distinct histograms labeled (a), (b), (c), and (d).
- Each histogram represents exactly 9 data points.
- All histograms utilize the same horizontal scale.
- Calculations are not allowed; comparisons must be made visually.
# Objective
- Determine the correct increasing order of the means:
\( \mu_a, \mu_b, \mu_c, \mu_d \)
# Underlying Idea
- The mean of a dataset can be viewed as its center of gravity on the number line.
- Since:
- Each dataset contains the same number of observations,
- The scale is consistent across all histograms,
we can assess the means by examining the central position of each distribution.
Key Reasoning:
- A greater concentration of data points at higher numerical values results in a higher mean.
- Conversely, a concentration of points at lower numerical values leads to a lower mean.
Thus, the histogram that is most "right-shifted" has the largest mean, while the one that is most "left-shifted" has the smallest mean.
# Careful Visual Evaluation
- **Distribution (c)**:
- Most bars are concentrated at the lower end of the scale.
- There are fewer observations in the higher value range.
- Its overall mass is positioned the furthest left, indicating it has the smallest mean.
- **Distribution (a)**:
- This distribution is slightly shifted to the right compared to (c).
- It retains a significant presence in the mid-to-lower range.
- Therefore, its mean is larger than (c) but smaller than the other two distributions.
- **Distribution (d)**:
- Exhibits a noticeable presence of higher values and is positioned further to the right than (a).
- Its center of mass indicates a mean greater than (a) but less than (b).
- **Distribution (b)**:
- Characterized by the strongest concentration of observations at the higher end.
- The majority of data points are situated in the higher value range.
- Consequently, its mean is the largest among the four distributions.
# Ordering the Means
From the visual analysis, the order from smallest to largest mean is:
\[
\mu_c < \mu_a < \mu_d < \mu_b
\]
# Final Answer (Summary)
\[
\mu_c < \mu_a < \mu_d < \mu_b
\]
Question:
generate ien more unique and different wording well explaned and sturctured solution
This is AI generated Response.
Asked by: nayan
Created at: 2026-02-24 08:41:43
Final Answer:
RenderedRaw Text
Did you like this answer?
# Given Information
- Four histograms labeled (a), (b), (c), and (d) are presented.
- Each histogram contains exactly 9 data points.
- All histograms share the same horizontal scale.
- The objective is to determine the order of their means without performing numerical calculations.
# Objective
- Establish the increasing order of the means:
\( \mu_a, \mu_b, \mu_c, \mu_d \)
# Fundamental Principle
- The mean can be conceptualized as the center of mass of the data on a number line.
- Since each distribution consists of the same number of observations (9) and uses an identical scale, we can compare the means based on the visual placement of the data.
Key Insight:
- A higher concentration of measurements at larger numerical values results in a higher mean.
- Conversely, a higher concentration at smaller numerical values results in a lower mean.
As such, the histogram that appears most shifted to the right has the greatest mean, while the one that appears most shifted to the left has the smallest mean.
# Detailed Visual Evaluation
- **Distribution (c)**:
- The majority of its bars cluster at the lower end of the scale, with very few data points reaching higher values.
- This concentration indicates that its center of mass is the furthest to the left, suggesting it has the smallest mean among the four distributions.
- **Distribution (a)**:
- This histogram is shifted slightly to the right of (c).
- It contains significant data points in the mid-to-lower range, making its mean higher than that of (c) but still lower than the remaining distributions.
- **Distribution (d)**:
- This histogram shows a noticeable presence of higher values compared to (a), indicating its center of mass is further right.
- However, it does not extend into the highest ranges as much as (b), placing its mean between those of (a) and (b).
- **Distribution (b)**:
- Characterized by a strong concentration of observations in the higher value range.
- The majority of its data points lie at the upper end of the scale, resulting in its mean being the largest of all distributions.
# Ordering the Means
From the visual assessment, the sequence from the smallest to the largest mean is established as follows:
\[
\mu_c < \mu_a < \mu_d < \mu_b
\]
# Final Answer (Summary)
\[
\mu_c < \mu_a < \mu_d < \mu_b
\]
This arrangement reflects the relative positions of the means based on the distribution of the data in each histogram.
Question:
generate oenmro unqiue and -plagarism free solution in difefrenbt worsing and 1.25 longer
This is AI generated Response.
Asked by: nayan
Created at: 2026-02-24 08:42:38
Final Answer:
RenderedRaw Text
Did you like this answer?
# Given Information
- Four histograms labeled (a), (b), (c), and (d) are provided.
- Each histogram contains exactly 9 data points.
- All histograms utilize the same horizontal scale for comparison.
- Calculations are not allowed; the task relies solely on visual analysis.
# Objective
- Determine the correct increasing order of the means:
\( \mu_a, \mu_b, \mu_c, \mu_d \)
# Fundamental Principle
- The mean can be interpreted as the "balance point" or center of gravity of the dataset represented by the histogram.
- Given that each histogram has the same number of observations and shares a uniform scale, we can effectively compare their means by observing the distribution of data across the number line.
Key Insight:
- When a distribution has a greater concentration of data points at larger numerical values, it will result in a higher mean.
- Conversely, if the majority of observations cluster around smaller numerical values, the mean will be lower.
Thus, the histogram that is most skewed to the right will exhibit the largest mean, while the one that is most skewed to the left will reflect the smallest mean.
# Detailed Visual Evaluation
- **Distribution (c)**:
- The histogram displays the majority of its bars concentrated toward the lower end of the scale, with minimal representation in the higher value range.
- This indicates that the center of mass for this distribution is positioned farthest to the left among the four, leading to the conclusion that it has the smallest mean.
- **Distribution (a)**:
- While this histogram is somewhat shifted to the right of (c), it still contains a considerable amount of data in the lower to mid-range.
- This distribution's balance point lies above that of (c), suggesting that its mean is greater than that of (c) but less than the remaining distributions.
- **Distribution (d)**:
- This histogram showcases a significant presence of higher value observations, indicating its center of mass is further right compared to (a).
- Nevertheless, while it is more right-heavy than (a), it does not reach the extreme right as much as (b) does, resulting in its mean being placed between those of (a) and (b).
- **Distribution (b)**:
- Characterized by a robust concentration of data points at the higher end of the scale, this histogram displays the majority of its observations in the upper value range.
- Consequently, this rightward shift means that its mean is the largest among all four distributions.
# Ordering the Means
From the visual assessment, we can establish the order of means from the smallest to the largest:
\[
\mu_c < \mu_a < \mu_d < \mu_b
\]
This sequence reflects the relative positions of the means based on the data distribution observed in each histogram.
# Final Answer (Summary)
\[
\mu_c < \mu_a < \mu_d < \mu_b
\]
This arrangement signifies that the mean of distribution (c) is the lowest, followed by (a), then (d), and finally (b) holding the highest mean.
Question:
generate one mroe solution unique
This is AI generated Response.
Asked by: nayan
Created at: 2026-02-24 08:43:54
Final Answer:
RenderedRaw Text
Did you like this answer?
# Given Information
- Four histograms labeled (a), (b), (c), and (d) are presented for analysis.
- Each histogram contains a total of 9 data points.
- All histograms are plotted on the same horizontal scale.
- The task is to determine the order of their means without performing any calculations; visual reasoning is required.
# Objective
- Establish the correct increasing order of the means:
\( \mu_a, \mu_b, \mu_c, \mu_d \)
# Fundamental Principle
- The mean is understood as the "center of mass" or the average value of the dataset represented by each histogram.
- Since each dataset contains an equal number of observations (9) and utilizes a consistent scale, we can effectively assess the means by examining where the bulk of data is distributed along the number line.
Key Insight:
- If a distribution has a higher concentration of data points at larger numerical values, its mean will be elevated.
- Conversely, a distribution that clusters more around smaller numerical values will yield a lower mean.
This leads to the conclusion that the histogram displaying the most rightward skew will feature the largest mean, while the one skewed to the left will show the smallest mean.
# Detailed Visual Evaluation
- **Distribution (c)**:
- This histogram shows a significant concentration of its bars toward the lower end of the scale, with only a few data points appearing in the higher ranges.
- This distribution's center of mass is positioned furthest left, indicating that it has the smallest mean among the four histograms.
- **Distribution (a)**:
- This histogram is slightly shifted to the right compared to (c), with a moderate number of observations distributed in the lower to mid-range.
- Therefore, its mean is greater than that of (c), but it remains lower than the other two distributions.
- **Distribution (d)**:
- In this histogram, there is a noticeable presence of higher value observations, positioning its center of mass further to the right than that of (a).
- However, it does not extend as far into the highest values as (b), which places its mean between those of (a) and (b).
- **Distribution (b)**:
- This histogram is marked by a strong concentration of observations at higher numerical values, with most of its data points clustered in the upper range.
- As a result, its center of mass is positioned furthest to the right, leading to the highest mean among all distributions.
# Ordering the Means
Based on the visual analysis of the data distributions, the order of means from the smallest to the largest can be established as follows:
\[
\mu_c < \mu_a < \mu_d < \mu_b
\]
This conclusion reflects the relative positions of the means as determined by the observed distributions in each histogram.
# Final Answer (Summary)
\[
\mu_c < \mu_a < \mu_d < \mu_b
\]
This arrangement indicates that distribution (c) has the smallest mean, followed by (a), then (d), and finally, (b) has the largest mean, based on the visual evaluation of the histograms.
VIPSolutions focuses on clear, step‑by‑step explanations so you can learn quickly. Whether you need an AI‑generated walkthrough or a short hint to get unstuck, each solution is organized for fast reading and easy review later.
Search similar questions, compare approaches, and bookmark the best answers for revision. Our goal is simple: quick, reliable study help that feels natural—not noisy.
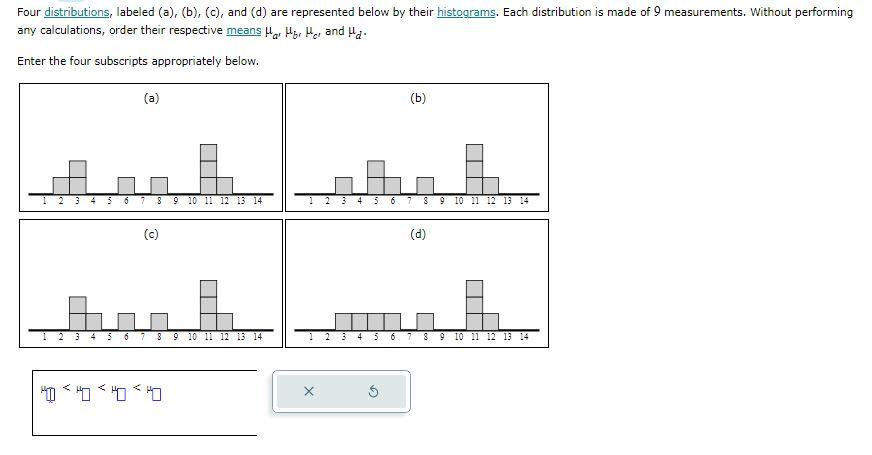 Four distributions, labeled (a), (b), (c), and (d) are represented below by their histograms. Each distribution is made of 9 measurements. Without performing
i an, cs ae dan, Do
Entre four sibs srl blo
(a) (b)
(©) (@
mn
Four distributions, labeled (a), (b), (c), and (d) are represented below by their histograms. Each distribution is made of 9 measurements. Without performing
i an, cs ae dan, Do
Entre four sibs srl blo
(a) (b)
(©) (@
mn