Give step-by-step solution with explanation and final answer:Problem 2. Decision Tree (21 points)
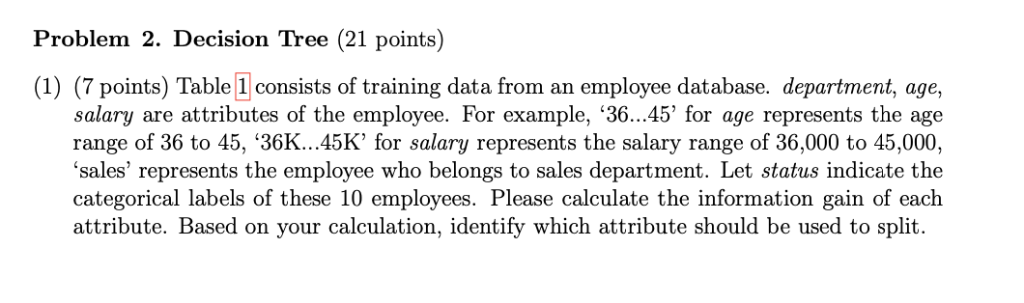
(1) (7 points) Table 1/ consists of training data from an employee database. department, age,
salary are attributes of the employee. For example, ‘36...45’ for age represents the age
range of 36 to 45, ‘36K...45K’ for salary represents the salary range of 36,000 to 45,000,
‘sales’ represents the employee who belongs to sales department. Let status indicate the
categorical labels of these 10 employees. Please calculate the information gain of each
attribute. Based on your calculation, identify which attribute should be used to split.
department age salary status
sales 36.45 36K...45K senior
sales 26...35 26K...35K junior
sales 36.45 26K..35K junior
systems ~~ 46..55 46K..55K senior
systems ~~ 36..45 46K...55K senior
systems ~~ 36..45 36K...45K junior
systems ~~ 26..35 26K..35K junior
marketing 36...45 36K...45K senior
marketing 36...45 26K...35K junior
marketing 26.35 26K...35K junior
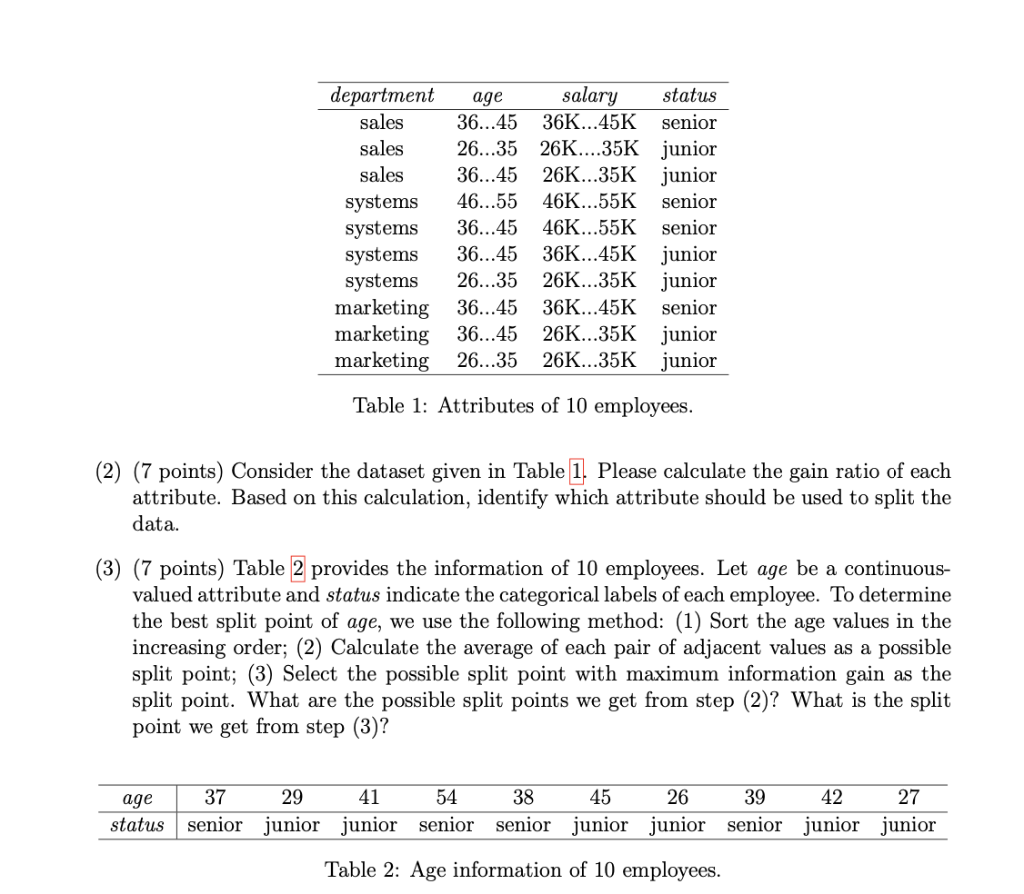
Table 1: Attributes of 10 employees.
(2) (7 points) Consider the dataset given in Table[1| Please calculate the gain ratio of each
attribute. Based on this calculation, identify which attribute should be used to split the
data.
(3) (7 points) Table [2 provides the information of 10 employees. Let age be a continuous-
valued attribute and status indicate the categorical labels of each employee. To determine
the best split point of age, we use the following method: (1) Sort the age values in the
increasing order; (2) Calculate the average of each pair of adjacent values as a possible
split point; (3) Select the possible split point with maximum information gain as the
split point. What are the possible split points we get from step (2)? What is the split
point we get from step (3)?
age 37 29 41 54 38 45 26 39 42 27
status | senior junior junior senior senior junior junior senior junior junior
Table 2: Age information of 10 employees.
Question:
Give step-by-step solution with explanation and final answer:Problem 2. Decision Tree (21 points)
(1) (7 points) Table 1/ consists of training data from an employee database. department, age,
salary are attributes of the employee. For example, ‘36...45’ for age represents the age
range of 36 to 45, ‘36K...45K’ for salary represents the salary range of 36,000 to 45,000,
‘sales’ represents the employee who belongs to sales department. Let status indicate the
categorical labels of these 10 employees. Please calculate the information gain of each
attribute. Based on your calculation, identify which attribute should be used to split.
department age salary status
sales 36.45 36K...45K senior
sales 26...35 26K...35K junior
sales 36.45 26K..35K junior
systems ~~ 46..55 46K..55K senior
systems ~~ 36..45 46K...55K senior
systems ~~ 36..45 36K...45K junior
systems ~~ 26..35 26K..35K junior
marketing 36...45 36K...45K senior
marketing 36...45 26K...35K junior
marketing 26.35 26K...35K junior
Table 1: Attributes of 10 employees.
(2) (7 points) Consider the dataset given in Table[1| Please calculate the gain ratio of each
attribute. Based on this calculation, identify which attribute should be used to split the
data.
(3) (7 points) Table [2 provides the information of 10 employees. Let age be a continuous-
valued attribute and status indicate the categorical labels of each employee. To determine
the best split point of age, we use the following method: (1) Sort the age values in the
increasing order; (2) Calculate the average of each pair of adjacent values as a possible
split point; (3) Select the possible split point with maximum information gain as the
split point. What are the possible split points we get from step (2)? What is the split
point we get from step (3)?
age 37 29 41 54 38 45 26 39 42 27
status | senior junior junior senior senior junior junior senior junior junior
Table 2: Age information of 10 employees.
This is AI generated Response.
Asked by: gvr
Created at: 2025-08-02 05:25:02
VIPSolutions focuses on clear, step‑by‑step explanations so you can learn quickly. Whether you need an AI‑generated walkthrough or a short hint to get unstuck, each solution is organized for fast reading and easy review later.
Search similar questions, compare approaches, and bookmark the best answers for revision. Our goal is simple: quick, reliable study help that feels natural—not noisy.
 Problem 2. Decision Tree (21 points)
(1) (7 points) Table 1/ consists of training data from an employee database. department, age,
salary are attributes of the employee. For example, ‘36...45’ for age represents the age
range of 36 to 45, ‘36K...45K’ for salary represents the salary range of 36,000 to 45,000,
‘sales’ represents the employee who belongs to sales department. Let status indicate the
categorical labels of these 10 employees. Please calculate the information gain of each
attribute. Based on your calculation, identify which attribute should be used to split.
department age salary status
sales 36.45 36K...45K senior
sales 26...35 26K...35K junior
sales 36.45 26K..35K junior
systems ~~ 46..55 46K..55K senior
systems ~~ 36..45 46K...55K senior
systems ~~ 36..45 36K...45K junior
systems ~~ 26..35 26K..35K junior
marketing 36...45 36K...45K senior
marketing 36...45 26K...35K junior
marketing 26.35 26K...35K junior
Table 1: Attributes of 10 employees.
(2) (7 points) Consider the dataset given in Table[1| Please calculate the gain ratio of each
attribute. Based on this calculation, identify which attribute should be used to split the
data.
(3) (7 points) Table [2 provides the information of 10 employees. Let age be a continuous-
valued attribute and status indicate the categorical labels of each employee. To determine
the best split point of age, we use the following method: (1) Sort the age values in the
increasing order; (2) Calculate the average of each pair of adjacent values as a possible
split point; (3) Select the possible split point with maximum information gain as the
split point. What are the possible split points we get from step (2)? What is the split
point we get from step (3)?
age 37 29 41 54 38 45 26 39 42 27
status | senior junior junior senior senior junior junior senior junior junior
Table 2: Age information of 10 employees.
Problem 2. Decision Tree (21 points)
(1) (7 points) Table 1/ consists of training data from an employee database. department, age,
salary are attributes of the employee. For example, ‘36...45’ for age represents the age
range of 36 to 45, ‘36K...45K’ for salary represents the salary range of 36,000 to 45,000,
‘sales’ represents the employee who belongs to sales department. Let status indicate the
categorical labels of these 10 employees. Please calculate the information gain of each
attribute. Based on your calculation, identify which attribute should be used to split.
department age salary status
sales 36.45 36K...45K senior
sales 26...35 26K...35K junior
sales 36.45 26K..35K junior
systems ~~ 46..55 46K..55K senior
systems ~~ 36..45 46K...55K senior
systems ~~ 36..45 36K...45K junior
systems ~~ 26..35 26K..35K junior
marketing 36...45 36K...45K senior
marketing 36...45 26K...35K junior
marketing 26.35 26K...35K junior
Table 1: Attributes of 10 employees.
(2) (7 points) Consider the dataset given in Table[1| Please calculate the gain ratio of each
attribute. Based on this calculation, identify which attribute should be used to split the
data.
(3) (7 points) Table [2 provides the information of 10 employees. Let age be a continuous-
valued attribute and status indicate the categorical labels of each employee. To determine
the best split point of age, we use the following method: (1) Sort the age values in the
increasing order; (2) Calculate the average of each pair of adjacent values as a possible
split point; (3) Select the possible split point with maximum information gain as the
split point. What are the possible split points we get from step (2)? What is the split
point we get from step (3)?
age 37 29 41 54 38 45 26 39 42 27
status | senior junior junior senior senior junior junior senior junior junior
Table 2: Age information of 10 employees.