Sales: November, 2 0 2 2 Actual Sales were $ 1 , 5 0 0 , 0 0 0 and December, 2 0 2 2 Actual Sales were $ 2 , 1 0 0 , 0 0 0 Budgeted Sales for the first 5 months of 2 0 2 3 are: January 3 0 , 0 0 0 units February 4 0 , 0 0 0 units March 5 0 , 0 0 0 units April 4 5 , 0 0 0 units May 3 5 , 0 0 0 units Budgeted selling price is $ 6 0 / unit All sales are made on the account. 3 0 % is collected in the month of the sale, 5 0 % is collected in the first month following the sale, and the remaining 2 0 % is collected in the second month after the sale. The company wants to maintain a finished goods inventory equal to 4 0 % of next month ’ s budgeted units of sales. Each unit of production requires 3 kg of materials. The company maintains raw materials inventory equal to 2 0 % of next month ’ s production needs. The budgeted purchase price for raw materials is $ 8 / kg . All purchases of materials are made on account. 3 0 % of the month ’ s purchases are paid in the month of purchase and the remaining 7 0 % are paid the following month. Each unit of production requires 2 direct labor hours. The direct labor rate per hour is $ 6 / hour and all labor costs are paid by the end of the month. Variable manufacturing overhead per direct labor hour is $ 2 . The budgeted monthly fixed manufacturing overhead is $ 2 0 0 , 0 0 0 which includes monthly depreciation of $ 2 5 , 0 0 0 . Variable selling expenses per unit sold are $ 2 / unit . The budgeted monthly fixed selling and administrative expenses are $ 1 2 0 , 0 0 0 which includes monthly depreciation of $ 2 0 , 0 0 0 . The company will be acquiring some additional equipment in the first quarter of the year. They will purchase equipment for $ 3 0 0 , 0 0 0 in cash in January. Dividends of $ 1 5 0 , 0 0 0 will be paid out in March. The company has a policy that it needs to maintain a cash balance of $ 5 0 , 0 0 0 at all times. They do have a line of credit with their bank. It has an annual interest rate of 1 2 % . Borrowing, if needed, will occur at the beginning of the month and repayment of the principal and interest will occur at the end of the month. Borrowings and repayments are done in increments of $ 5 , 0 0 0 . REQUIRED: Prepare the sales budget for each month of the first quarter. Prepare the schedule of expected cash collections for each month of the first quarter. Prepare the production budget for each month of the first quarter. Prepare the direct materials budget for each month of the first quarter. Prepare the schedule of cash payments to supplier for each month of the first quarter. Prepare the direct labor budget for each month of the first quarter. Prepare the manufacturing overhead budget for each month of the first quarter. Prepare the selling and administrative expense budget for each month of the first quarter. Prepare the cash budget for each month of the first quarter. Prepare the budgeted income statement for the full quarter. Prepare the budgeted balance sheet as of March 3 1 , 2 0 2 3 . give full answer and give final summaryAlbert Enterprises Balance Sheet December 31,2022 [Cash $ 110000 [Accounts Receivable $ 1,770,000 Raw Materials $ 163200 Finished Goods $540,000 Total Current Assets $ 2,583,200 Net Property, Plant & Equipment $ 1,200,000 Total Assets [Liabilities & Stockholders Equity |_| [Accounts Payable Total Current Liabilities § 571,200 Notes Payable $s - Total Liabilities § 571,200 Common Stock $ 1,500,000 Retained Earnings. $ 1,712,000 Total liabilities & Stockholders Equity 1
Question:
Sales: November,
2
0
2
2
Actual Sales were $
1
,
5
0
0
,
0
0
0
and December,
2
0
2
2
Actual Sales were $
2
,
1
0
0
,
0
0
0
Budgeted Sales for the first
5
months of
2
0
2
3
are:
January
3
0
,
0
0
0
units February
4
0
,
0
0
0
units March
5
0
,
0
0
0
units April
4
5
,
0
0
0
units May
3
5
,
0
0
0
units Budgeted selling price is $
6
0
/
unit All sales are made on the account.
3
0
%
is collected in the month of the sale,
5
0
%
is collected in the first month following the sale, and the remaining
2
0
%
is collected in the second month after the sale. The company wants to maintain a finished goods inventory equal to
4
0
%
of next month
’
s budgeted units of sales. Each unit of production requires
3
kg of materials. The company maintains raw materials inventory equal to
2
0
%
of next month
’
s production needs. The budgeted purchase price for raw materials is $
8
/
kg
.
All purchases of materials are made on account.
3
0
%
of the month
’
s purchases are paid in the month of purchase and the remaining
7
0
%
are paid the following month. Each unit of production requires
2
direct labor hours. The direct labor rate per hour is $
6
/
hour and all labor costs are paid by the end of the month. Variable manufacturing overhead per direct labor hour is $
2
.
The budgeted monthly fixed manufacturing overhead is $
2
0
0
,
0
0
0
which includes monthly depreciation of $
2
5
,
0
0
0
.
Variable selling expenses per unit sold are $
2
/
unit
.
The budgeted monthly fixed selling and administrative expenses are $
1
2
0
,
0
0
0
which includes monthly depreciation of $
2
0
,
0
0
0
.
The company will be acquiring some additional equipment in the first quarter of the year. They will purchase equipment for $
3
0
0
,
0
0
0
in cash in January.
Dividends of $
1
5
0
,
0
0
0
will be paid out in March. The company has a policy that it needs to maintain a cash balance of $
5
0
,
0
0
0
at all times. They do have a line of credit with their bank. It has an annual interest rate of
1
2
%
.
Borrowing, if needed, will occur at the beginning of the month and repayment of the principal and interest will occur at the end of the month. Borrowings and repayments are done in increments of $
5
,
0
0
0
.
REQUIRED: Prepare the sales budget for each month of the first quarter. Prepare the schedule of expected cash collections for each month of the first quarter. Prepare the production budget for each month of the first quarter. Prepare the direct materials budget for each month of the first quarter. Prepare the schedule of cash payments to supplier for each month of the first quarter. Prepare the direct labor budget for each month of the first quarter. Prepare the manufacturing overhead budget for each month of the first quarter. Prepare the selling and administrative expense budget for each month of the first quarter. Prepare the cash budget for each month of the first quarter. Prepare the budgeted income statement for the full quarter. Prepare the budgeted balance sheet as of March
3
1
,
2
0
2
3
.
give full answer and give final summary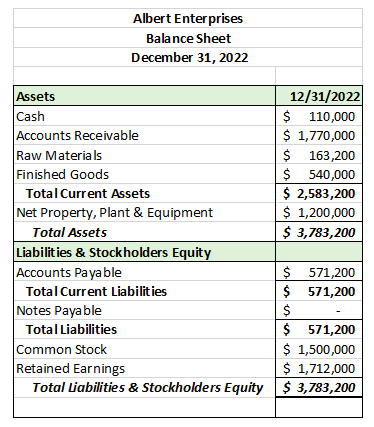 Albert Enterprises
Balance Sheet
December 31,2022
[Cash $ 110000
[Accounts Receivable $ 1,770,000
Raw Materials $ 163200
Finished Goods $540,000
Total Current Assets $ 2,583,200
Net Property, Plant & Equipment $ 1,200,000
Total Assets
[Liabilities & Stockholders Equity |_|
[Accounts Payable
Total Current Liabilities § 571,200
Notes Payable $s -
Total Liabilities § 571,200
Common Stock $ 1,500,000
Retained Earnings. $ 1,712,000
Total liabilities & Stockholders Equity
1
Albert Enterprises
Balance Sheet
December 31,2022
[Cash $ 110000
[Accounts Receivable $ 1,770,000
Raw Materials $ 163200
Finished Goods $540,000
Total Current Assets $ 2,583,200
Net Property, Plant & Equipment $ 1,200,000
Total Assets
[Liabilities & Stockholders Equity |_|
[Accounts Payable
Total Current Liabilities § 571,200
Notes Payable $s -
Total Liabilities § 571,200
Common Stock $ 1,500,000
Retained Earnings. $ 1,712,000
Total liabilities & Stockholders Equity
1
Asked by: sreegeeth
Created at: 2025-11-15 08:58:11
Final Answer:
Question:
give final summary and give 2 sentence summary in each steps like 1 to 11
Asked by: sreegeeth
Created at: 2025-11-15 09:02:02
Final Answer:
Question:
i want sepparate final summary like all question answer only
Asked by: sreegeeth
Created at: 2025-11-15 09:04:24
Final Answer:
Question:
not text only answer in number in final summary
Asked by: sreegeeth
Created at: 2025-11-15 09:06:52
Final Answer:
📢 Instructions:
- Ask anything relatd to above question only.
- For new Question goto :