this is my result and these are my hypotheses what should i write ?Hypothesis Statement H1a Higher ESG performance (ESG_Index) is positively associated with financial performance (e.g., NI, MKT CAP). H1b Stronger financial performance is positively associated with improved ESG performance (a reversed version of the model). this is the hypothesis and give me content according to this to write it in my data analysis and results section?& JMP Fle Edt Tables Rows Cols DOE Analyze Graph Tools View Window Help © ® 2 Q 8 sun27.ul 2040 © © Cleaned_Data_New - it Mixed rer 0z2erne BED = Mixed Model for ESG_Index @ * Actual by Predicted Plot * Actual by Conditional Predicted Plot Fit Statistics arte 6 Sermon 127 Slogthabons | sw22irs prs Sorstra £3 are * Random Effects Covariance Parameter Estimates variance wasp Component VarRatlo Estimate Su ror 5% Lower 95% Upper Va Pct of Tota Locton 036016 001713 0d6zm0i2 00000 1112603 02000 | 200% fe Vigrisos Otaeres osamsts 1 suieies Hon Tour Vee Ousoos Oomeet riers 000m Fixed Effects Parameter Estimates ndctr Gog | E80 Go Tom Estimate SEmor DfDen (Rate Proto 05% Lower 95% Upper Pot Zioowa Tames me 300 ony | mre | Toes VERT tenes Ge ime 3m oon oom aves WTCp Somes dmsces ize Ids Oluss aaies 2aises TOMS cooler ssver mr 14 over dames seamed 2 Ped Log Liens 0873010 * Random Coefficients Fixed Effects Tests Source Noam DFum DFDen Rao Prov» ew 1 Cie same ooo WTC 1 1 2s zis owe Tos 1 1 er zee anes * ~ Marginal Model Profiler §rooss 4 _— frp — ~ ye - = IB0"=280 a ~@80- "C= \ @ & JMP Fle Edt Tables Rows Cols DOE Analyze Graph Tools View Window Help © ® 2 Q 8 sun27.4ul 2040 © © ® Cleaned_Data_New - Fit Mixed rere rne BED = Mixed Model for MKT CAP @ * Actual by Predicted Plot * Actual by Conditional Predicted Plot * Fit Statistics are oe 6 Sn ormeies 121 So aboot 2077285 prs ptt Es San * Random Effects Covariance Parameter Estimates saiance aap Component VarRatlo Estimate Sul mor 5% Lower 95% Upper Value Pet of Total i ee Fac sion sooerte saseorzr erase oe Tou Sezer cooorars izsooesn Tocoense 00 * Fixed Effects Parameter Estimates ndctr Gag | E8633 Tom Gamat Siro Ofban Rat Proohl 06% Lover 36% Upper Pom 0zsz Towsmii 220 0% Os owiors ssn BAL Gree Ovsy ws fs cone osm loose TONAS Osis Goodie 192 S01 oo awemme Goer Vow Sao omsto 1:0 4m ames mses uma Bae ico iow loss 20 Cour aren soem 2 eid Log ince 2957852 * Random Coefficients * Fixed Effects Tests Soca Noun DFMum OFOwn Fate Prob ara eo sows coo TAs 1 1 tee momen won ve TT 20 aoe ames EG 1 1 ooo maw Omor * ~ Marginal Model Profiler ~ ye - = IB0"=280"a ~@80- "C= \ @
Question:
this is my result and these are my hypotheses what should i write ?Hypothesis Statement
H1a Higher ESG performance (ESG_Index) is positively associated with financial performance (e.g., NI, MKT CAP).
H1b Stronger financial performance is positively associated with improved ESG performance (a reversed version of the model).
this is the hypothesis and give me content according to this to write it in my data analysis and results section?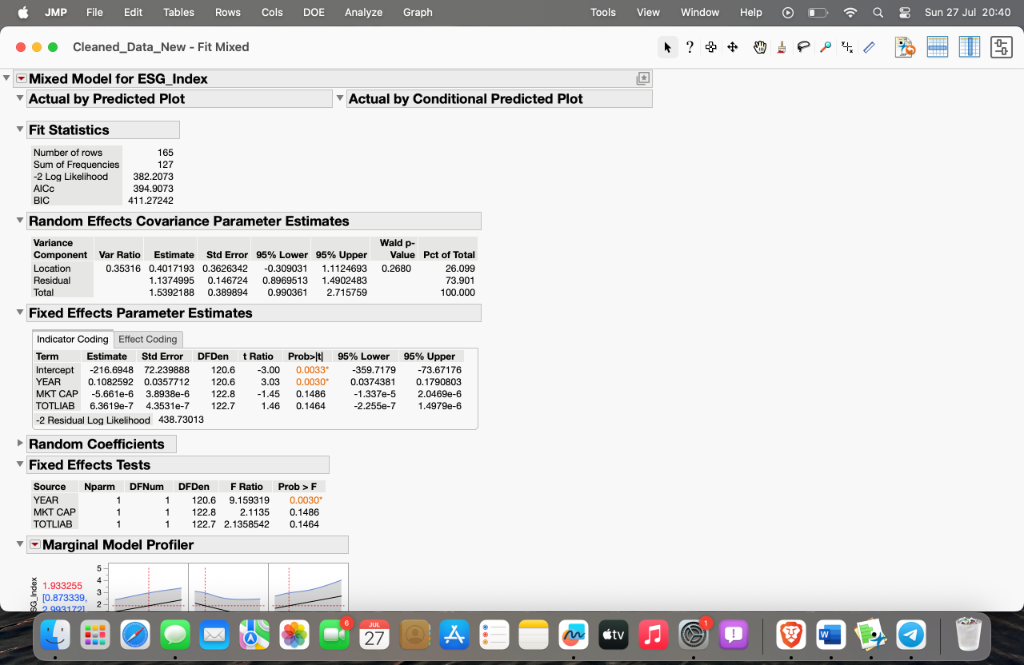
 & JMP Fle Edt Tables Rows Cols DOE Analyze Graph Tools View Window Help © ® 2 Q 8 sun27.ul 2040
© © Cleaned_Data_New - it Mixed rer 0z2erne BED
= Mixed Model for ESG_Index @
* Actual by Predicted Plot * Actual by Conditional Predicted Plot
Fit Statistics
arte 6
Sermon 127
Slogthabons | sw22irs
prs Sorstra
£3 are
* Random Effects Covariance Parameter Estimates
variance wasp
Component VarRatlo Estimate Su ror 5% Lower 95% Upper Va Pct of Tota
Locton 036016 001713 0d6zm0i2 00000 1112603 02000 | 200%
fe Vigrisos Otaeres osamsts 1 suieies Hon
Tour Vee Ousoos Oomeet riers 000m
Fixed Effects Parameter Estimates
ndctr Gog | E80 Go
Tom Estimate SEmor DfDen (Rate Proto 05% Lower 95% Upper
Pot Zioowa Tames me 300 ony | mre | Toes
VERT tenes Ge ime 3m oon oom aves
WTCp Somes dmsces ize Ids Oluss aaies 2aises
TOMS cooler ssver mr 14 over dames seamed
2 Ped Log Liens 0873010
* Random Coefficients
Fixed Effects Tests
Source Noam DFum DFDen Rao Prov»
ew 1 Cie same ooo
WTC 1 1 2s zis owe
Tos 1 1 er zee anes
* ~ Marginal Model Profiler
§rooss 4 _—
frp —
~ ye - =
IB0"=280 a ~@80- "C= \ @
& JMP Fle Edt Tables Rows Cols DOE Analyze Graph Tools View Window Help © ® 2 Q 8 sun27.4ul 2040
© © ® Cleaned_Data_New - Fit Mixed rere rne BED
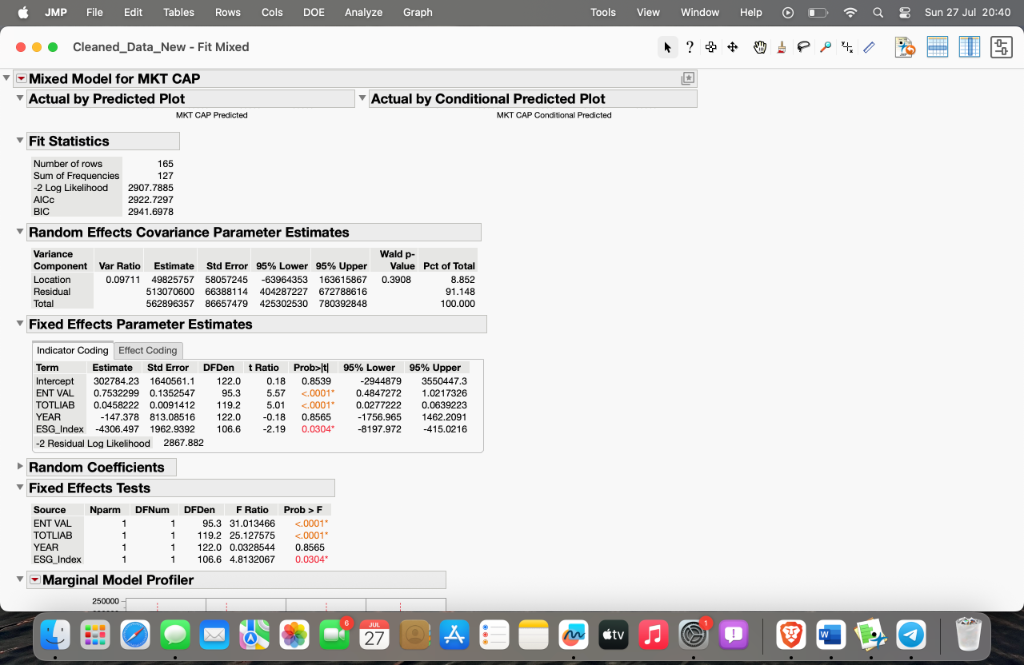
= Mixed Model for MKT CAP @
* Actual by Predicted Plot * Actual by Conditional Predicted Plot
* Fit Statistics
are oe 6
Sn ormeies 121
So aboot 2077285
prs ptt
Es San
* Random Effects Covariance Parameter Estimates
saiance aap
Component VarRatlo Estimate Sul mor 5% Lower 95% Upper Value Pet of Total
i ee
Fac sion sooerte saseorzr erase oe
Tou Sezer cooorars izsooesn Tocoense 00
* Fixed Effects Parameter Estimates
ndctr Gag | E8633
Tom Gamat Siro Ofban Rat Proohl 06% Lover 36% Upper
Pom 0zsz Towsmii 220 0% Os owiors ssn
BAL Gree Ovsy ws fs cone osm loose
TONAS Osis Goodie 192 S01 oo awemme Goer
Vow Sao omsto 1:0 4m ames mses uma
Bae ico iow loss 20 Cour aren soem
2 eid Log ince 2957852
* Random Coefficients
* Fixed Effects Tests
Soca Noun DFMum OFOwn Fate Prob
ara eo sows coo
TAs 1 1 tee momen won
ve TT 20 aoe ames
EG 1 1 ooo maw Omor
* ~ Marginal Model Profiler
~ ye - =
IB0"=280"a ~@80- "C= \ @
& JMP Fle Edt Tables Rows Cols DOE Analyze Graph Tools View Window Help © ® 2 Q 8 sun27.ul 2040
© © Cleaned_Data_New - it Mixed rer 0z2erne BED
= Mixed Model for ESG_Index @
* Actual by Predicted Plot * Actual by Conditional Predicted Plot
Fit Statistics
arte 6
Sermon 127
Slogthabons | sw22irs
prs Sorstra
£3 are
* Random Effects Covariance Parameter Estimates
variance wasp
Component VarRatlo Estimate Su ror 5% Lower 95% Upper Va Pct of Tota
Locton 036016 001713 0d6zm0i2 00000 1112603 02000 | 200%
fe Vigrisos Otaeres osamsts 1 suieies Hon
Tour Vee Ousoos Oomeet riers 000m
Fixed Effects Parameter Estimates
ndctr Gog | E80 Go
Tom Estimate SEmor DfDen (Rate Proto 05% Lower 95% Upper
Pot Zioowa Tames me 300 ony | mre | Toes
VERT tenes Ge ime 3m oon oom aves
WTCp Somes dmsces ize Ids Oluss aaies 2aises
TOMS cooler ssver mr 14 over dames seamed
2 Ped Log Liens 0873010
* Random Coefficients
Fixed Effects Tests
Source Noam DFum DFDen Rao Prov»
ew 1 Cie same ooo
WTC 1 1 2s zis owe
Tos 1 1 er zee anes
* ~ Marginal Model Profiler
§rooss 4 _—
frp —
~ ye - =
IB0"=280 a ~@80- "C= \ @
& JMP Fle Edt Tables Rows Cols DOE Analyze Graph Tools View Window Help © ® 2 Q 8 sun27.4ul 2040
© © ® Cleaned_Data_New - Fit Mixed rere rne BED
= Mixed Model for MKT CAP @
* Actual by Predicted Plot * Actual by Conditional Predicted Plot
* Fit Statistics
are oe 6
Sn ormeies 121
So aboot 2077285
prs ptt
Es San
* Random Effects Covariance Parameter Estimates
saiance aap
Component VarRatlo Estimate Sul mor 5% Lower 95% Upper Value Pet of Total
i ee
Fac sion sooerte saseorzr erase oe
Tou Sezer cooorars izsooesn Tocoense 00
* Fixed Effects Parameter Estimates
ndctr Gag | E8633
Tom Gamat Siro Ofban Rat Proohl 06% Lover 36% Upper
Pom 0zsz Towsmii 220 0% Os owiors ssn
BAL Gree Ovsy ws fs cone osm loose
TONAS Osis Goodie 192 S01 oo awemme Goer
Vow Sao omsto 1:0 4m ames mses uma
Bae ico iow loss 20 Cour aren soem
2 eid Log ince 2957852
* Random Coefficients
* Fixed Effects Tests
Soca Noun DFMum OFOwn Fate Prob
ara eo sows coo
TAs 1 1 tee momen won
ve TT 20 aoe ames
EG 1 1 ooo maw Omor
* ~ Marginal Model Profiler
~ ye - =
IB0"=280"a ~@80- "C= \ @
Asked by: Khushi
Created at: 2025-07-28 01:12:23
Final Answer:
Question:
just see the p value
Asked by: Khushi
Created at: 2025-07-28 01:14:35
Final Answer:
📢 Instructions:
- Ask anything relatd to above question only.
- For new Question goto :